Giss at .77c for September!

Then I assume you reject any relationship between CO2 and temperature.

Of course, that would be ignoring the points that CO2 absorbs IR and that increasing temperatures decrease carbonate solubility. And that would assume that you have some OTHER cause for the increasing temperatures of the last 150 years and for the rise in CO2 levels coincident with Milankovitch warming. Of course the Milankovitch cycles are only coincidental, right? We don't KNOW that orbital variations would cause warming or cooling. Particularly as SLOWLY as they change things. They've just been plotted at convenient scales to make it LOOK as if they're related.

Right?

Disappointing, Ian.
 
Hey Elektra, I certainly did link to the jobs. Right there in the list of adds for millwrights and electricians. Did it say that the jobs were 100K? No. But with the combination of a rotating 4 day on-off shift, and overtime, so in a single rotation often has six working days, many of the more ambitious craftsmen make 100k in a year.

Now you stated that you controled the steel that we send to Isreal, and I called bullshit on that, we have our own metallurgists and quality control. Ours is a multi-national company, based out of the London Exchange, with a Russian origin. Now if you know steel as well as you claim, you know the name of the company.
 
Then I assume you reject any relationship between CO2 and temperature.

Of course, that would be ignoring the points that CO2 absorbs IR and that increasing temperatures decrease carbonate solubility. And that would assume that you have some OTHER cause for the increasing temperatures of the last 150 years and for the rise in CO2 levels coincident with Milankovitch warming. Of course the Milankovitch cycles are only coincidental, right? We don't KNOW that orbital variations would cause warming or cooling. Particularly as SLOWLY as they change things. They've just been plotted at convenient scales to make it LOOK as if they're related.

Right?

Disappointing, Ian.
Yet, there is no proof that C
Hey Elektra, I certainly did link to the jobs. Right there in the list of adds for millwrights and electricians. Did it say that the jobs were 100K? No. But with the combination of a rotating 4 day on-off shift, and overtime, so in a single rotation often has six working days, many of the more ambitious craftsmen make 100k in a year.

Now you stated that you controled the steel that we send to Isreal, and I called bullshit on that, we have our own metallurgists and quality control. Ours is a multi-national company, based out of the London Exchange, with a Russian origin. Now if you know steel as well as you claim, you know the name of the company.
Old Crock linked to a "job search engine", not the 100k steel job Old Crock stated existed, which Old Crock stated to win an argument.

Yea, it starts with an E, and its profit has sucked in recent years.

How is that for a fast reply, no google search Old Crock, Evarez

And dumb ass, Metallurgist and Quality Control, are not the ones who will control the quality of Armor Plate being shipped to Israel, it is me, ASNT certified NDT Technician.

Old Crock, you don't know Jack Shit about your business.

How about a link, dummy.

Google

  • Ndt Jobs, Employment in Oregon | Indeed.com
    www.indeed.com/q-Ndt-l-Oregon-jobs.html
    Indeed.com

    Jobs 1 - 10 of 20 - 20 Ndt Jobs available in Oregon on Indeed.com. one search. all jobs. ... Sponsored by EVRAZ North America - 30+ days ago ... NDT Technician.
  • Ndt Jobs, Employment in Canby, OR | Indeed.com
    www.indeed.com/q-Ndt-l-Canby,-OR-jobs.html
    Indeed.com

    Jobs 1 - 10 of 19 - Sponsored by EVRAZ North America - 30+ days ago ...Radiographer, ndt, ndt tech, manufacturing, aerospace, level 2 certification, level ii .

Old Crock, you actually knew your own business better than me, to top it off, Old Crock calls me the Moron, Old Crock how many times have you called me stupid, yet a baited you, trolled you right into making a fool of yourself.

Old Crock, you did not even recognize an ASME standard, American Society of Mechanical Engineers

You most likely did not even know, Iconell 600 is the brand name of an Iron Nickel stainless steel.

Thanks for the help, proving Old Crock is a CROCK
 
Hey Elektra, I certainly did link to the jobs. Right there in the list of adds for millwrights and electricians. Did it say that the jobs were 100K? No. But with the combination of a rotating 4 day on-off shift, and overtime, so in a single rotation often has six working days, many of the more ambitious craftsmen make 100k in a year.

Now you stated that you controled the steel that we send to Isreal, and I called bullshit on that, we have our own metallurgists and quality control. Ours is a multi-national company, based out of the London Exchange, with a Russian origin. Now if you know steel as well as you claim, you know the name of the company.

Wow, NDT, you see Old Crock, all that metal has to be tested, which the metallurgist does not do, unless you want to destroy the metal. So you got what they call, Non Destructive Testing. NDT people test the metal without destroying it, so you can ship high quality product.
Here is the guy in charge of some Russian Steel Company in Oregon, now how could I possible even know this job existed?

Puzzling, huh, Old Crock

Dustin Rosendahl LinkedIn

nt
  • NDT Systems Coordinator at Evraz NA - Portland Spiral Mill
Past
 
Besides your ego, what does this conversation have to do with anything pertinent to this forum?
 
Then I assume you reject any relationship between CO2 and temperature.

Of course, that would be ignoring the points that CO2 absorbs IR and that increasing temperatures decrease carbonate solubility. And that would assume that you have some OTHER cause for the increasing temperatures of the last 150 years and for the rise in CO2 levels coincident with Milankovitch warming. Of course the Milankovitch cycles are only coincidental, right? We don't KNOW that orbital variations would cause warming or cooling. Particularly as SLOWLY as they change things. They've just been plotted at convenient scales to make it LOOK as if they're related.

Right?

Disappointing, Ian.

I think you should stop assuming, because you get my thoughts and intentions wrong every time.

if you have a specific question, ask it. dont conjure up what you think I will say and then beat up the strawman.
 
http://data.giss.nasa.gov/gistemp/tabledata_v3/GLB.Ts dSST.txt

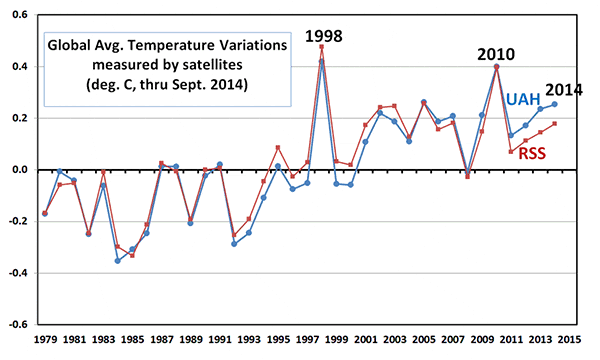
2010 and 1998 cooled down big time from here on out as they entered their nina's! The chances of 2014 taking the RECORD are going up!

We're running away with it! Maybe this is the end of the pause?


Really? You really believe this may be the warmest year ever? How gullible are you? It isn't even the warmest year in the satellite era which all honest folks know, began at a very cool point in modern history...it is why the warmers like to use it as a cut off date as opposed to the 30's which were warmer than the present.

Yearly-global-LT-UAH-RSS-thru-Sept-2014.gif
 
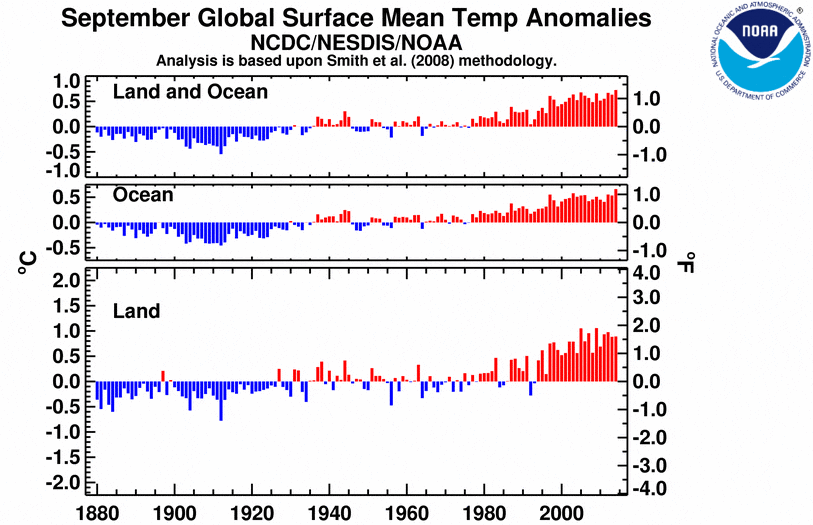
You know why your plot doesn't look like this plot?

201409.gif


Cause looking down through a hundred miles of atmosphere isn't the best way to take certain temperatures.

To the man with only a hammer, all problems start to look like nails. Like to Roy Spencer.
 
You know why your plot doesn't look like this plot?

201409.gif


Cause looking down through a hundred miles of atmosphere isn't the best way to take certain temperatures.

To the man with only a hammer, all problems start to look like nails. Like to Roy Spencer.
And taking ground measurements that require constant adjustment is?

What a dupe.
 
Jo Nova got it right when she said:

"It might be the hottest year if you live in a white louvered box above a carpark, next to a concrete-heat-sink-superstructure, and not far from a runway. Though even then you might need to be homogenized andadjusted to really feel the heat. But for the rest of the surface of the Earth, 2014 is not a record, not even close."
 
Falling back to the debunked "surface sites are bad!" conspiracy so soon? I guess when all the data disagrees with you, you'll use any excuse to ignore it.
 
Went through this with Dr. Muller. He, too, had doubts as to the adjustments made for environment on surface sites. So he did a really humongous study to see if the sites were skewing the data. I give the deniers credit for this, that they were so sure that the scientists were making mistakes, that the Koch Brothers kicked in a major portion of the money that made the study possible. Dr. Muller talked to Dr. Hansen before the study, and Dr. Hansen welcomed that study.

So, when the study was done, the conclusion was that the adjustments made were proper, and that the scientists like Dr. Hansen were presenting accurate data. And the people that had claimed that they would accept the results of the study, immediatly condemned it and Dr. Muller.

Berkeley Earth

Global land temperatures have increased by 1.5 degrees C over the past 250 years
Berkeley Earth has just released analysis of land-surface temperature records going back 250 years, about 100 years further than previous studies. The analysis shows that the rise in average world land temperature globe is approximately 1.5 degrees C in the past 250 years, and about 0.9 degrees in the past 50 years.


Temperature, CO2, and volcano data | More recent data | High-resolution image

Temperature, CO2, and volcano data | More recent data | High-resolution image
Land temperature with 1- and 10-year running averages. The shaded regions are the one- and two-standard deviation uncertainties calculated including both statistical and spatial sampling errors. Prior land results from the other groups are also plotted. The NASA GISS record had a land mask applied; the HadCRU curve is the simple land average, not the hemispheric-weighted one.

Berkeley Earth also has carefully studied issues raised by skeptics, such as possible biases from urban heating, data selection, poor station quality, and data adjustment. We have demonstrated that these do not unduly bias the results.
 
One can clearly see the human effect in this data.

Berkeley Earth

Human Effect

Many of the changes in land-surface temperature can be explained by a combination of volcanoes and a proxy for human greenhouse gas emissions. Solar variation does not seem to impact the temperature trend.


Temperature, CO2, and volcano data | More recent data | High-resolution image

Temperature, CO2, and volcano data | More recent data | High-resolution image
The annual and decadal land surface temperature from the BerkeleyEarth average, compared to a linear combination of volcanic sulfate emissions and the natural logarithm of CO2. It is observed that the large negative excursions in the early temperature records are likely to be explained by exceptional volcanic activity at this time. Similarly, the upward trend is likely to be an indication of anthropogenic changes. The grey area is the 95% confidence interval.

Click here to see the historic temperature record with named volcanos.

After accounting for volcanic and human effects, the residual variability in land-surface temperature is observed to closely mirror (and for slower changes slightly lead) variations in the Gulf Stream.
Dude all of this and you still can't just show what 120 PPM of CO2 does to temperatures. Why is that? Your so full of all of this shite why is it you fail daily? Just would like to know why you are limited?
 
Falling back to the debunked "surface sites are bad!" conspiracy so soon? I guess when all the data disagrees with you, you'll use any excuse to ignore it.
ahem....Just in the area around Chicago alone there are temperature readings per town/city. Per city the high for a day is mostly always different. Middway airport is the hottest reading most days, Aurora is most often the coolest. So, aren't there people in these cities, and for those who are in Aurora feeling the same heat as those around Midway? Nope!! So your big arse term global ain't accurate at all. BTW, it is an average you're referring to, so there is a high number and there is a low number are those two tossed out for the report? Is that done in their dataset? Just exactly what is done? In laymens terms.
 
Good God, Just Crazy, are you so computer illiterate that you cannot find those things yourself? Here, get back to us in a few days when you have had time to look at all the data;

Berkeley Earth
data set. DATASET. See I don't have the niffty little applications to run the datasets that come up on websites. I'm not buying them either. So in simple little terms, what is the procedure to create the graphs?

Do they throw out the highest and lowest and then average? I'm just asking a simple little question. Can't you ever just answer a fnnn question without being beligerent?

They throw out everything and just make up whatever is needed to support the story line.
 
ahem....Just in the area around Chicago alone there are temperature readings per town/city. Per city the high for a day is mostly always different. Middway airport is the hottest reading most days, Aurora is most often the coolest. So, aren't there people in these cities, and for those who are in Aurora feeling the same heat as those around Midway? Nope!! So your big arse term global ain't accurate at all. BTW, it is an average you're referring to, so there is a high number and there is a low number are those two tossed out for the report? Is that done in their dataset? Just exactly what is done? In laymens terms.

In layman's terms? The UHI is a known factor, and it is compensated for in temperature averages.

Also, rural stations show the same upwards temperature trend as urban stations, in the same amounts, hence we know the warming is not a UHI artifact.

Now, some of this stuff is not capable of being described in "layman's terms". There's a Feynman quote that goes "If I could explain it to the average person, it wouldn't have been worth the Nobel prize."
 
Last edited:
ahem....Just in the area around Chicago alone there are temperature readings per town/city. Per city the high for a day is mostly always different. Middway airport is the hottest reading most days, Aurora is most often the coolest. So, aren't there people in these cities, and for those who are in Aurora feeling the same heat as those around Midway? Nope!! So your big arse term global ain't accurate at all. BTW, it is an average you're referring to, so there is a high number and there is a low number are those two tossed out for the report? Is that done in their dataset? Just exactly what is done? In laymens terms.

In layman's terms? The UHI is a known factor, and it is compensated for in temperature averages.

Also, rural stations show the same upwards temperature trend as urban stations, in the same amounts, hence we know the warming is not a UHI artifact.
no they don't. they just don't.
 

Forum List

Back
Top