Giss at .77c for September!

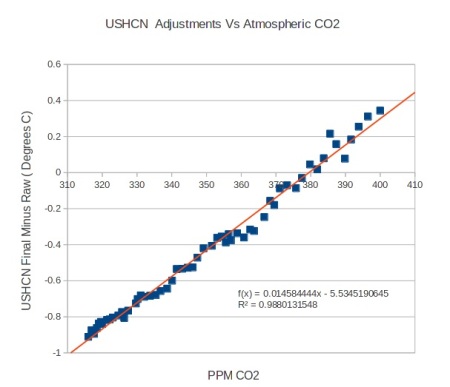
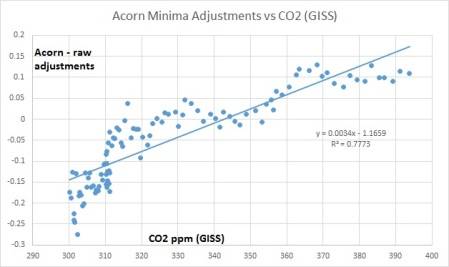
hey Matt- you know what seems to correlate best with rising CO2 levels?


temperature dataset adjustments!!!! hahahaha

goddard-co2.jpg


acorn-vs-co2.jpg
 
And the AGW cult will try and make any weather event fit their religious scriptures.

The average of global land and sea temperatures is not a "weather event".

"they entered their nina's!"

What are El Niño and La Niña?
El Niño and La Niña are complex weather patterns resulting from variations in ocean temperatures in the Equatorial Pacific.

What are El Ni o and La Ni a

EL Nino is a weather event.. Please go back and read your AGW cult members OP..

Anything that casts doubt on their dogma is weather....
 
Can you not read your own posts? El Nino and La Nina are "weather patterns". They could be termed events composed of the occurrence of weather patterns, but they are not events of weather. They are seasonal. They can last for years. They are not weather.
 
Can you not read your own posts? El Nino and La Nina are "weather patterns". They could be termed events composed of the occurrence of weather patterns, but they are not events of weather. They are seasonal. They can last for years. They are not weather.

Yes the weather = climate bit from the AGW cult..

Yes you got caught in yet another lie and instead of being a man and admitting you were wrong, you decided to act like a two year old (the mentality of the far left as well as the AGW cult), stomp your feet and post that weather = climate.
 
hey Matt- you know what seems to correlate best with rising CO2 levels?


temperature dataset adjustments!!!! hahahaha

goddard-co2.jpg


acorn-vs-co2.jpg
What are the chances that the adjustment in temperature would be EXACTLY what is necessary to trend WITH CO2?

IF we removed their adjustments there would be a zero correlation with CO2. Which is what should be given a LOG vs LINEAR trend. But some how the LINEAR trend matches the LOG Trend (a bell curve)....

How was this one to one ratio obtained? It should not exist!
 
Wow. Incredible. Which process do you believe to be linear? And between CO2 and temperature, which do you think fits a bell curve?
 
Just the level of knowledge, intellect, and logic we have come to expect from Billy Boob.
No need to expect nothing but cowardice from Old Crock.

Old Crock, how come you are hiding from your comments about the steel industry?

Old Crock is an old filthy liar, hits others with insults and lies, then hides when called to the table.

Pure cowardice and shameful.
 
Hmmm.........

Care to name whatever you are yowling about, Elektra, ol' fart?
Old Crock made claims that jobs for 100k were available in the steel industry then could not link to the company.

Further Old Crock disparaged my profession stating my profession has zero to do with the quality of steel.

I challenged old crock to prove his knowledge of steel by explaining what this graphic of my work has to do with high quality steel.
 

Attachments

  • 1413770197656.jpg
    1413770197656.jpg
    249.8 KB · Views: 140
Last edited:
Hmmm.........

Care to name whatever you are yowling about, Elektra, ol' fart?
Old Crock made claims that jobs for 100k were available in the steel industry then could not link to the company.

Further Old Crock disparaged my profession stating my profession has zero to do with the quality of steel.

I challenged old crock to prove his knowledge of steel by explaining what this graphic of my work has to do with high quality steel.


This would have been quite the snappy comeback if only your "graphic" had approached legibility. That you post a phone pic of the graphic tells me you don't have an electronic copy of the thing. I guess they don't trust you with the complicated stuff.

And, seems to me you're a business major. Just what WOULD your line of work have to do with the quality of steel??
 
1413777746260.jpg
Hmmm.........

Care to name whatever you are yowling about, Elektra, ol' fart?
Old Crock made claims that jobs for 100k were available in the steel industry then could not link to the company.

Further Old Crock disparaged my profession stating my profession has zero to do with the quality of steel.

I challenged old crock to prove his knowledge of steel by explaining what this graphic of my work has to do with high quality steel.


This would have been quite the snappy comeback if only your "graphic" had approached legibility. That you post a phone pic of the graphic tells me you don't have an electronic copy of the thing. I guess they don't trust you with the complicated stuff.

And, seems to me you're a business major. Just what WOULD your line of work have to do with the quality of steel??
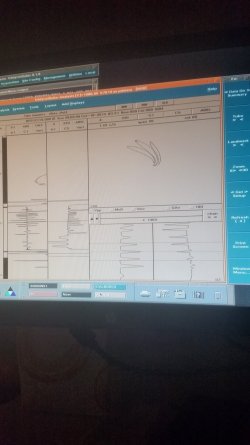
It is a thumbnail you can open, once open you can see in the lissajou window I am calibrating the absolute channel, which is the 240 khz. On the strip charts you can see the P1 mix channel which eliminates the support signal, which can be seen in the channel 4 strip chart.

I am calibrating the system to analyze inconell 600. In the lissajou window you can see the phase difference between the 20%, 40%, 60%, as 80% threw wall signals manufactured into the calibration standard.

It is not a graphic I took a pic of, it's simply a pic of the computer screen I use to do work. I am on an old Unix system that is running proprietary software, the data is owned by the customer, so there is non-disclosure agreements and stuff.

yes, what does phase analysis, hysteresis, inductive reactance, and Faraday have to do with metal.

A business major? Hardly, this is science, after I analyze the data my results, my report will go to engineers and metallurgist.

Energy and steel go hand and gand, I am involved in both.
 
Last edited:
hey Matt- you know what seems to correlate best with rising CO2 levels?


temperature dataset adjustments!!!! hahahaha

goddard-co2.jpg


acorn-vs-co2.jpg


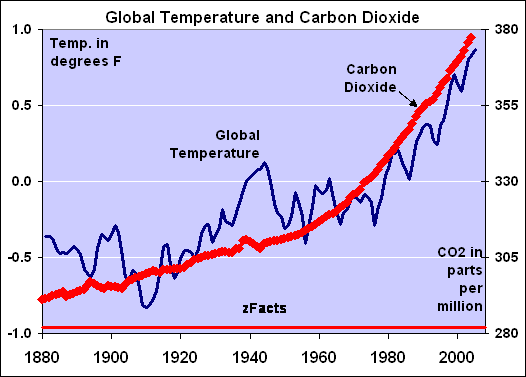
I am surprised that no one has said, "But IanC, any two things that are increasing can be made to look correlated by simply choosing the axes labels in a way that supports the idea you are presenting".

Exactly!!!! at least these graphs are actually plotting one thing against another.


some graphs dont even do that.

zFacts-CO2-Temp.gif


here is one that simply OVERLAYS one graphic on top of the other! our eyes see the general agreement in the curves and many people jump to the conclusion that they are related. honest science?
 

Forum List

Back
Top