Giss at .77c for September!

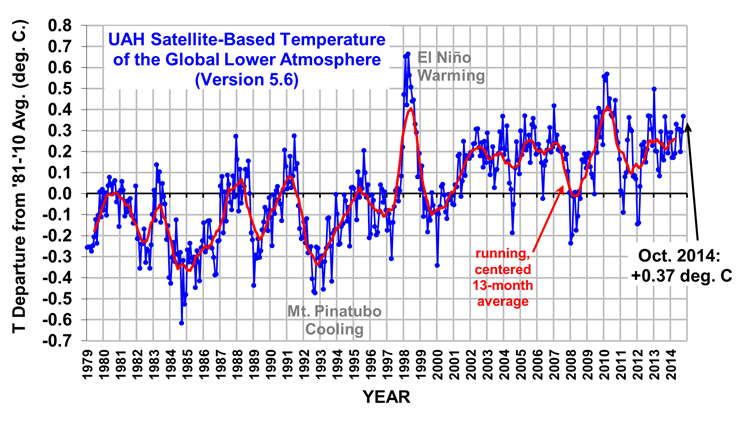
Well, before the week is out, we will know how October ranks, and that leaves only two months. If they are warm also, 2014 will be the warmest on record. In a neutral ENSO. In a year with a neutral ENSO, we surpassed the 1998 monster ENSO. Yet fools still insist that it is cooling. LOL

2014 on Track to Be Hottest Year on Record - Scientific American

Just days after NASA data showed that August 2014 was the warmest August on record, the National Oceanic and Atmospheric Administration confirmed the ranking and raised the ante: There’s a good chance 2014 could become the warmest year on record.

“If we continue a consistent departure from average for the rest of 2014, we will edge out 2010 as the warmest year on record,” said Jake Crouch, a climatologist with NOAA’s National Climatic Data Center, during a press briefing Thursday.

Specifically, if each of the remaining months of the year ranks among the top five warmest, 2014 will take the top spot, he said.
 
A warm year for Great Britian

Met Office Could 2014 be the hottest year on record Western Daily Press

Forecasters have not ruled out that 2014 could be the hottest year on record, as long as November and December remain mild.

With just under two months of the year remaining the Met Office is unable to predict for certain what the next few weeks has in store for the UK but if there are not too many cold spells we could have experienced a record breaking year.

Despite it being so wet at the beginning of the year temperatures didn’t take their usual plummet in the winter months.

By the time the summer arrived the country basked in a prolonged heat wave during June and July pushing the average temperature up.

Here in the West the region had some very hot days. Somerset’s hottest temperature this year was 30.2C at Seavington, Hurcott Farm on July 26. In Gloucestershire the hottest temperature was 28.6C at Cirencester on July 26 and in Wiltshire the hottest was 28.9C at Larkhill on July 26. The hottest temperature was 28.3C in Bristol at Filton on July 24.

The heat has lasted until a few days ago when we had the warmest Halloween on record. Areas in Bristol recorded 23C on Friday.


Read more: Met Office Could 2014 be the hottest year on record Western Daily Press
Follow us: @WesternDaily on Twitter | WesternDaily on Facebook


Sure it will......Funny how all the observed weather is cold.


Powerful storm brings record snow to Southeast before it slams into New England

"Update: Nov. 3, 2014 10:33 a.m. ET: The storm blitzed central and downeast Maine, dropping more than a foot of snow and knocking off power to much of the state a day ahead of the midterm elections. Caribou and Bangor, Maine each set daily snowfall records for Nov. 2, and also saw the largest calendar day snowfall ever observed so early in the season. Power crews are working to restore power on Monday."

Powerful storm brings record snow to Southeast before it slams into New England
 
Or how about this graph showing the shenanigans being perpetrated in New Zealand. Funny how the observed temp record shows cooling but the homogenized shows major warming. Wonder how they pulled that little trick off?
rutherglen1.png


"Detecting trends in climate is important in assessments of global change based on regional long-term data. Equally important is the reliability of the results that are widely used as a major input for a large number of societal design and planning purposes. New Zealand provides a rare long temperature time series in the Southern Hemisphere, and it is one of the longest continuous climate series available in the Southern Hemisphere Pacific. It is therefore important that this temperature dataset meets the highest quality control standards. New Zealand’s national record for the period 1909 to 2009 is analysed and the data homogenized. Current New Zealand century-long climatology based on 1981 methods produces a trend of 0.91 °C per century. Our analysis, which uses updated measurement techniques and corrects for shelter-contaminated data, produces a trend of 0.28 °C per century."

Its funny, The USCRN shows 1.1 deg C cooling in 12 years and NZ shows a -0.46 deg C cooling trend but yet the new and improved homogenized crap shows 1.6 deg C warming... I get so tired of these people lying to us and demanding I give up all freedoms and be a slave. I really get pissed off at the little marxist bastards. I grow very tired of their lies.
 
You two are late with the debunked denier New Zealand nuttery.

You know, if we wanted to read WUWT, we'd just go there. It's not necessary to repost here every conspiracy theory that WUWT comes up with.
 
I really get pissed off at the little marxist bastards. I grow very tired of their lies.

On the other hand, we never get tired of laughing at you. That never gets old.

Cry for us, Billy, cry harder. I could really go for the delectable taste of some denier tears.


Only it's us laughing at you. You remind me of the mindless idiots who were predicting the Democrats would maintain control of the Senate.
 
Westwall, you won, so you're not supposed to be making sour grapes posts.

But then, I guess it's just your nature to be bitter, as it is ours to be cheerful. Drives you crazy, eh?
 
Westwall, you won, so you're not supposed to be making sour grapes posts.

But then, I guess it's just your nature to be bitter, as it is ours to be cheerful. Drives you crazy, eh?


:laugh::laugh::laugh::laugh::laugh::laugh: Cheerful is no an adjective I would ever equate with you and yours. Just sayin...
 
I get so tired of these people lying to us and demanding I give up all freedoms and be a slave. I really get pissed off at the little marxist bastards. I grow very tired of their lies.

Coming from the worst liar in creation, this is pretty ballsy.
 
Or how about this graph showing the shenanigans being perpetrated in New Zealand. Funny how the observed temp record shows cooling but the homogenized shows major warming. Wonder how they pulled that little trick off?
rutherglen1.png


"Detecting trends in climate is important in assessments of global change based on regional long-term data. Equally important is the reliability of the results that are widely used as a major input for a large number of societal design and planning purposes. New Zealand provides a rare long temperature time series in the Southern Hemisphere, and it is one of the longest continuous climate series available in the Southern Hemisphere Pacific. It is therefore important that this temperature dataset meets the highest quality control standards. New Zealand’s national record for the period 1909 to 2009 is analysed and the data homogenized. Current New Zealand century-long climatology based on 1981 methods produces a trend of 0.91 °C per century. Our analysis, which uses updated measurement techniques and corrects for shelter-contaminated data, produces a trend of 0.28 °C per century."

Its funny, The USCRN shows 1.1 deg C cooling in 12 years and NZ shows a -0.46 deg C cooling trend but yet the new and improved homogenized crap shows 1.6 deg C warming... I get so tired of these people lying to us and demanding I give up all freedoms and be a slave. I really get pissed off at the little marxist bastards. I grow very tired of their lies.
Check this info out from WUWT
justthefactswuwt / July 3, 2014
Guest Post By Walter Dnes:
link: GISS Hockey-Stick Adjustments Watts Up With That
"There have been various comments recently about GISS’ “dancing data”, and it just so happens that as GISS data is updated monthly, I’ve been downloading it monthly since 2008. In addition, I’ve captured some older versions via “The Wayback Machine“. Between those 2 sources, I have 94 monthly downloads between August 2005 and May 2014, but there are somegaps in the 2006 and 2007 downloads. Below is my analysis of the data."

Dancing data, I love it!!!!
 
Could all the WUWT trolls maybe make one thread for WUWT conspiracy posts?

Like I said, we all know where WUWT is. No need to repost every crank post here.
 
Could all the WUWT trolls maybe make one thread for WUWT conspiracy posts?

Like I said, we all know where WUWT is. No need to repost every crank post here.
why are you afraid of WUWT? Oh I know, the guest posts blow your theory to bits!!!!!
 
Who is afraid of an ignorant crank? It is just that so many people seem to think that an uneducated asshole with a blog equals evidence and work presented by those with decades of experiance in the field.
 
UAH Global Temperature Update for October 2014 0.37 deg. C Roy Spencer PhD

The Version 5.6 global average lower tropospheric temperature (LT) anomaly for October, 2014 is +0.37 deg. C, up from the September value of +0.29 deg. C (click for full size version):


The global, hemispheric, and tropical LT anomalies from the 30-year (1981-2010) average for the last 22 months are:

Looks like 2014 is still on track to be the warmest year on record.
 
Who is afraid of an ignorant crank? It is just that so many people seem to think that an uneducated asshole with a blog equals evidence and work presented by those with decades of experiance in the field.
he isn't writing the material. Does that somehow bother you? I don't understand him posting others material for folks to read and maybe learn from. I see that you sir are just jealous!!! How special that is for me. :welcome::welcome::welcome:
 
UAH Global Temperature Update for October 2014 0.37 deg. C Roy Spencer PhD

The Version 5.6 global average lower tropospheric temperature (LT) anomaly for October, 2014 is +0.37 deg. C, up from the September value of +0.29 deg. C (click for full size version):


The global, hemispheric, and tropical LT anomalies from the 30-year (1981-2010) average for the last 22 months are:

Looks like 2014 is still on track to be the warmest year on record.
Don't forget the post I put up already from WUWT, that shows that the data from the past is altered to make the now look warm. Ain't it fun?
 
Still fighting the Hockey Stick? In spite of more than a dozen differant reports from all over the world using many, many differant proxies that have backed up that graph? You people are pathetic. Dumb and dumber.
 
Still fighting the Hockey Stick? In spite of more than a dozen differant reports from all over the world using many, many differant proxies that have backed up that graph? You people are pathetic. Dumb and dumber.
Did I studder?
 

Forum List

Back
Top