Navigation
Install the app
How to install the app on iOS
Follow along with the video below to see how to install our site as a web app on your home screen.

Note: This feature currently requires accessing the site using the built-in Safari browser.
More options
You are using an out of date browser. It may not display this or other websites correctly.
You should upgrade or use an alternative browser.
You should upgrade or use an alternative browser.
Artic Sea Ice Increasing at Record Rates
- Thread starter PLYMCO_PILGRIM
- Start date
Old Rocks
Diamond Member
I might have known. Lordy, lordy, Watt is a clever liar snaring not so clever people who are too simple to simply google Arctic Ice, and go to the scientific sources for the data.
http://nsidc.org/data/seaice_index/images/daily_images/N_timeseries.png
As you can see, the 2009 freeze up has just caught up to the 2007 freeze up, the lowest on record. For a week or so, it was actually less than 2007. Yes, the rate was a record, just in the opposite direction that the charleton, James Watt, suggests.
mdn2000
Rookie
- Banned
- #3
I might have known. Lordy, lordy, Watt is a clever liar snaring not so clever people who are too simple to simply google Arctic Ice, and go to the scientific sources for the data.
http://nsidc.org/data/seaice_index/images/daily_images/N_timeseries.png
As you can see, the 2009 freeze up has just caught up to the 2007 freeze up, the lowest on record. For a week or so, it was actually less than 2007. Yes, the rate was a record, just in the opposite direction that the charleton, James Watt, suggests.
Old Crock, your the biggest charleton posting here, another example may refresh your drug damaged brain.
http://www.usmessageboard.com/energy/93857-100-alternative-energy-worldwide-by-2030-a-4.html
Now that you mention windmills I thought I would mention my favorite thing about windmills: that we pay for them with government money and they never get used. Why not just dump money into the street?
Really fucking stupid, aren't you, ol' Screamy?
BPA: Wind farm system sets output milestone | Oregon Business News - OregonLive.com
BPA: Wind farm system sets output milestone
By Ted Sickinger, The Oregonian
August 12, 2009, 4:55PM
The Bonneville Power Administration says the wind farms plugged into its transmission system blew past a notable milestone earlier this month, sending out 2,000 megawatts of electricity for more than an hour.
That's enough to power all of Seattle and Portland for that hour.
The 22 wind farms in eastern Oregon and Washington hit a new peak of 2,089 megawatts on the evening of Aug. 6., doubling the previous peak of 1,000 megawatts recorded in January 2008.
BPA operates three quarters of the region's transmission system and is responsible for balancing the region's energy supply and demand to keep the grid operating smoothly. As more of that energy comes from intermittent sources like wind, the agency has been forced to adapt its hydro system and build new transmission capability to keep pace.
Six of the 22 wind farms on its system came on line this year, and the agency expects wind power to triple in the next five years.
Old Crock, the article is a press release of BPA posing as an article. There is no technical information at all. Can you provide the actual BPA report and not the press release. The answer is no, Old Crcok never provides another source with technical information when requested for when challenged with fact a liar can only hide.
The biggest lie is Old Crock's claim that 2 gwh is enough power to supply two cities, it is not. Seattle alone requires over 3.5 gwh.
Without seeing the actual report and only a press release by a corportation there is no way to no what they are speaking of. The only reasonable explanation is that Old Crock is stating that wind farms are able to provide enough power to supply seattle when everyone is sleeping in the middle of the night during the lowest peak usage season, summer.
Everyone knows that Seattle needs more power in the winter, not the summer, more power during the day and not the night.
Further if we assume there are no other twisting of facts BPA was only able to produce 2 gwh for about 14 minutes in the last year. Given the windy season is now over and we are entering peak electrical usage the massive investment in the polluting wind farm is now sitting idle, huge waste of CO2.
How much energy is used to produce one ton of fiberglass.
How many tons of fiberglass in one windmill.
How many millions of tons of CO2 was released into the environment producing millions of tons of fiberglass
How is it a better use of the dwindling earths precious resources to have massive giant copper electrical generators sit idle for 99% of the year while tax payers subsidize the wind farm sitting idle.
There are no answers from the liberal/marxist, this is all about controling people, stealing our money to give to rich which are the environuts.
PLYMCO_PILGRIM
Gold Member
- Thread starter
- #4
I might have known. Lordy, lordy, Watt is a clever liar snaring not so clever people who are too simple to simply google Arctic Ice, and go to the scientific sources for the data.
http://nsidc.org/data/seaice_index/images/daily_images/N_timeseries.png
As you can see, the 2009 freeze up has just caught up to the 2007 freeze up, the lowest on record. For a week or so, it was actually less than 2007. Yes, the rate was a record, just in the opposite direction that the charleton, James Watt, suggests.
At least he didn't throw out, destroy, or lose the raw data when it contradicts his previously made claims......not that those who have been pushing a man-made global warming agenda would ever do that washingtonpost.com
Jay Canuck
by Crom you'll pay!
- Jul 30, 2009
- 3,090
- 214
- 48
I might have known. Lordy, lordy, Watt is a clever liar snaring not so clever people who are too simple to simply google Arctic Ice, and go to the scientific sources for the data.
http://nsidc.org/data/seaice_index/images/daily_images/N_timeseries.png
As you can see, the 2009 freeze up has just caught up to the 2007 freeze up, the lowest on record. For a week or so, it was actually less than 2007. Yes, the rate was a record, just in the opposite direction that the charleton, James Watt, suggests.
At least he didn't throw out, destroy, or lose the raw data when it contradicts his previously made claims......not that those who have been pushing a man-made global warming agenda would ever do that washingtonpost.com
so you got busted posting a balatant lie and your comeback is a link to a WaHoPo story........WOW....L.O.L - you are one chickenshit mutha fucka!
PLYMCO_PILGRIM
Gold Member
- Thread starter
- #7
I might have known. Lordy, lordy, Watt is a clever liar snaring not so clever people who are too simple to simply google Arctic Ice, and go to the scientific sources for the data.
http://nsidc.org/data/seaice_index/images/daily_images/N_timeseries.png
As you can see, the 2009 freeze up has just caught up to the 2007 freeze up, the lowest on record. For a week or so, it was actually less than 2007. Yes, the rate was a record, just in the opposite direction that the charleton, James Watt, suggests.
At least he didn't throw out, destroy, or lose the raw data when it contradicts his previously made claims......not that those who have been pushing a man-made global warming agenda would ever do that washingtonpost.com
so you got busted posting a balatant lie and your comeback is a link to a WaHoPo story........WOW....L.O.L - you are one chickenshit mutha fucka!
ITs not a lie, the nothern and southern icecaps, when combined, have not shrunk in the last 20 years. One has shrunk the other grew.
Pffft.
Actually folks, Old Rocks failed to even get the author of the article in question correct - it was not Watts, but rather Jeff Id of the Air Vent blog - the blog I believe was first to break the climategate emails wide open to the world.
Having failed to even recognize this most basic of facts is clear evidence that Old Rocks did not even read the linked information that began the thread, but rather went off on his utterly predictable defense of the flat-earth global warming religion.
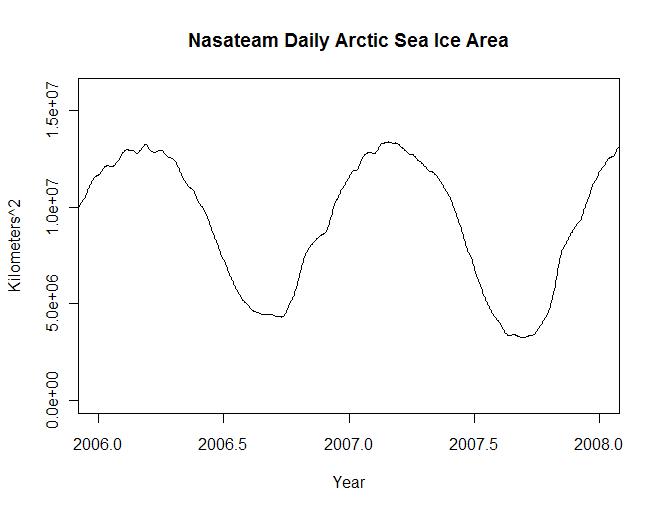
Within the context of the Jeff Id article, which is quite interesting, we see the final paragraphs correcting the false assumptions of the repeated global warmer headlines, and giving a far more even handed and likely statistically accurate accounting of the Arctic ice growth and decline patterns...
Looking at this plot of the 30 day slopes of actual NASA gridded data, the maximum ice melt rate occurs in 1999 and in 2004 not in 2007. Surprisingly the maximum ice growth rates occur in 2007 and 2008, I don’t remember those headlines for some reason. Don’t forget when looking at the 2008 – 09 peak, the data is preliminary and hasn’t been through the same processing as the other data. From looking at the unprocessed data I doubt it will change much.
Certainly the 30 year arctic trend in ice area is downward, even the most committed global warming scientist has to admit this happens regularly in climate along with regular 30 year uptrends. The questions are, did we cause it or not, and was CO2 the instigating factor. The rapid recovery of ice levels has to have some meaning regarding the severity of the problem. This goes directly in the face of accelerated global warming and the doom and gloom scenarios promoted by our politicians and polyscienticians.
Why are my conclusions different from the news reported records? I think it’s likely due to the fact that the scientists used the monthly data which is processed using a weighted filter of the daily data that incorporates a longer time frame than a single month. This means their use of the monthly data to establish a monthly trend was in error and the real record down trends were actually set in 1999, 2003 and 1984. While the record uptrends were in 2007, 2008 and 1996.
Arctic Sea Ice Increases at Record Rate « Watts Up With That?
If Old Rocks is not careful, he is going to accumulate a pile of failings on this topic to challenge those of Chris...
Having failed to even recognize this most basic of facts is clear evidence that Old Rocks did not even read the linked information that began the thread, but rather went off on his utterly predictable defense of the flat-earth global warming religion.
Within the context of the Jeff Id article, which is quite interesting, we see the final paragraphs correcting the false assumptions of the repeated global warmer headlines, and giving a far more even handed and likely statistically accurate accounting of the Arctic ice growth and decline patterns...
Looking at this plot of the 30 day slopes of actual NASA gridded data, the maximum ice melt rate occurs in 1999 and in 2004 not in 2007. Surprisingly the maximum ice growth rates occur in 2007 and 2008, I don’t remember those headlines for some reason. Don’t forget when looking at the 2008 – 09 peak, the data is preliminary and hasn’t been through the same processing as the other data. From looking at the unprocessed data I doubt it will change much.
Certainly the 30 year arctic trend in ice area is downward, even the most committed global warming scientist has to admit this happens regularly in climate along with regular 30 year uptrends. The questions are, did we cause it or not, and was CO2 the instigating factor. The rapid recovery of ice levels has to have some meaning regarding the severity of the problem. This goes directly in the face of accelerated global warming and the doom and gloom scenarios promoted by our politicians and polyscienticians.
Why are my conclusions different from the news reported records? I think it’s likely due to the fact that the scientists used the monthly data which is processed using a weighted filter of the daily data that incorporates a longer time frame than a single month. This means their use of the monthly data to establish a monthly trend was in error and the real record down trends were actually set in 1999, 2003 and 1984. While the record uptrends were in 2007, 2008 and 1996.
Arctic Sea Ice Increases at Record Rate « Watts Up With That?
If Old Rocks is not careful, he is going to accumulate a pile of failings on this topic to challenge those of Chris...
I might have known. Lordy, lordy, Watt is a clever liar snaring not so clever people who are too simple to simply google Arctic Ice, and go to the scientific sources for the data.
http://nsidc.org/data/seaice_index/images/daily_images/N_timeseries.png
As you can see, the 2009 freeze up has just caught up to the 2007 freeze up, the lowest on record. For a week or so, it was actually less than 2007. Yes, the rate was a record, just in the opposite direction that the charleton, James Watt, suggests.
But, but, it's a graph on a right wing website!
It must be true!
Actually folks, Old Rocks failed to even get the author of the article in question correct - it was not Watts, but rather Jeff Id of the Air Vent blog - the blog I believe was first to break the climategate emails wide open to the world.
Having failed to even recognize this most basic of facts is clear evidence that Old Rocks did not even read the linked information that began the thread, but rather went off on his utterly predictable defense of the flat-earth global warming religion.
Within the context of the Jeff Id article, which is quite interesting, we see the final paragraphs correcting the false assumptions of the repeated global warmer headlines, and giving a far more even handed and likely statistically accurate accounting of the Arctic ice growth and decline patterns...
Looking at this plot of the 30 day slopes of actual NASA gridded data, the maximum ice melt rate occurs in 1999 and in 2004 not in 2007. Surprisingly the maximum ice growth rates occur in 2007 and 2008, I dont remember those headlines for some reason. Dont forget when looking at the 2008 09 peak, the data is preliminary and hasnt been through the same processing as the other data. From looking at the unprocessed data I doubt it will change much.
Certainly the 30 year arctic trend in ice area is downward, even the most committed global warming scientist has to admit this happens regularly in climate along with regular 30 year uptrends. The questions are, did we cause it or not, and was CO2 the instigating factor. The rapid recovery of ice levels has to have some meaning regarding the severity of the problem. This goes directly in the face of accelerated global warming and the doom and gloom scenarios promoted by our politicians and polyscienticians.
Why are my conclusions different from the news reported records? I think its likely due to the fact that the scientists used the monthly data which is processed using a weighted filter of the daily data that incorporates a longer time frame than a single month. This means their use of the monthly data to establish a monthly trend was in error and the real record down trends were actually set in 1999, 2003 and 1984. While the record uptrends were in 2007, 2008 and 1996.
Arctic Sea Ice Increases at Record Rate « Watts Up With That?
If Old Rocks is not careful, he is going to accumulate a pile of failings on this topic to challenge those of Chris...[/QUOTE]
___
PLYMCO_PILGRIM
Gold Member
- Thread starter
- #11
I might have known. Lordy, lordy, Watt is a clever liar snaring not so clever people who are too simple to simply google Arctic Ice, and go to the scientific sources for the data.
http://nsidc.org/data/seaice_index/images/daily_images/N_timeseries.png
As you can see, the 2009 freeze up has just caught up to the 2007 freeze up, the lowest on record. For a week or so, it was actually less than 2007. Yes, the rate was a record, just in the opposite direction that the charleton, James Watt, suggests.
But, but, it's a graph on a right wing website!
It must be true!
Oh but its a peer reveiwed study, it must be accurate

(in case you haven't heard several scientists have been exposed altering the peer review process to deny anything that may go against the status-quo on man made warming)
Similar threads
- Replies
- 7
- Views
- 234
- Replies
- 163
- Views
- 1K
- Replies
- 38
- Views
- 605
Latest Discussions
- Replies
- 106
- Views
- 313
- Replies
- 12
- Views
- 39
- Replies
- 3K
- Views
- 36K
Forum List
-
-
-
-
-
Political Satire 8064
-
-
-
-
-
-
-
-
-
-
-
-
-
-
-
-
-
-
-
ObamaCare 781
-
-
-
-
-
-
-
-
-
-
-
Member Usernotes 470
-
-
-
-
-
-
-
-
-
-