So franco hater dupe, even after you know the facts, you're going to stand there and lie that the US has 12 Aircraft Carriers the UK 3, and the no one else has more than one?
Really?
You're stupid
You're a liar
Yep, you're a democrat.

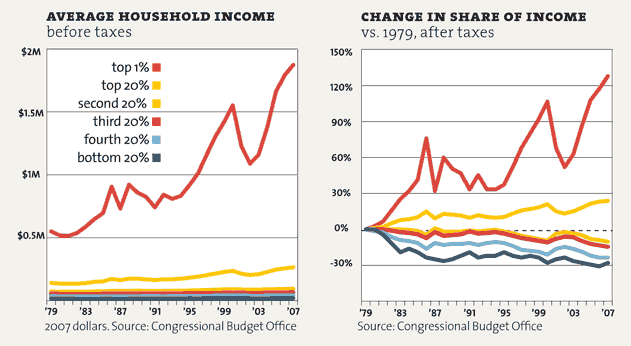
What you dumbasses don't realize is that the Republican party used to be a party of the people. I voted for Eisenhower, Goldwater, Nixon three times.....even Reagan the first time. Then I saw what he was doing to the middle class by slashing tax rates for the rich and continuing to spend at an increasing rate. I went twenty years and didn't even vote. The present day Republican party works for the rich and corporations and couldn't care less for the working people in America. I'll never vote for one of the "bought and paid for" assholes again. If adjusted for inflation the poorest half of working America have actually lost buying power in the last thirty years:
I've got a handful....Suck It!!!
World caught up, we are not going back to the 50s no matter how much the liberals want to.
I've got a handfull.......suck it!
Going senile ?
We have just as much money, but under Raygun tax rates etc, it all goes to the wealthy....duh.
The Demise of the American Middle Class In Numbers.
Over the past 30 years the American dream has gradually disappeared. The process was slow, so most people didn’t notice. They just worked a few more hours, borrowed a little more and cut back on non-essentials. But looking at the numbers and comparing them over long time periods, it is obvious that things have changed drastically. Here are the details:
1. WORKERS PRODUCE MORE BUT THE GAINS GO TO BUSINESS.
Over the past 63 years worker productivity has grown by 2.0% per year.
But after 1980, workers received a smaller share every year. Labor’s share of income (1992 = 100%):
1950 = 101%
1960 = 105%
1970 = 105%
1980 = 105% – Reagan
1990 = 100%
2000 = 96%
2007 = 92%
A 13% drop since 1980
2. THE TOP 10% GET A LARGER SHARE.
Share of National Income going to Top 10%:
1950 = 35%
1960 = 34%
1970 = 34%
1980 = 34% – Reagan
1990 = 40%
2000 = 47%
2007 = 50%
An increase of 16% since Reagan.
3. WORKERS COMPENSATED FOR THE LOSS OF INCOME BY SPENDING THEIR SAVINGS.
The savings Rose up to Reagan and fell during and after.
1950 = 6.0%
1960 = 7.0%
1970 = 8.5%
1980 = 10.0% – Reagan
1982 = 11.2% – Peak
1990 = 7.0%
2000 = 2.0%
2006 = -1.1% (Negative = withdrawing from savings)
A 12.3% drop after Reagan.
4. WORKERS ALSO BORROWED TO MAKE UP FOR THE LOSS.
Household Debt as percentage of GDP:
1965 = 46%
1970 = 45%
1980 = 50% – Reagan
1990 = 61%
2000 = 69%
2007 = 95%
A 45% increase after 1980.
5. SO THE GAP BETWEEN THE RICHEST AND THE POOREST HAS GROWN.
Gap Between the Share of Capital Income earned by the top 1%
and the bottom 80%:
1980 = 10%
2003 = 56%
A 5.6 times increase.
6. AND THE AMERICAN DREAM IS GONE.
The Probably of Moving Up from the Bottom 40% to the Top 40%:
1945 = 12%
1958 = 6%
1990 = 3%
2000 = 2%
A 10% Decrease.
Links:
1 =
ftp://ftp.bls.gov/pub/special.requests/pf/totalf1.txt
1 =
https://www.clevelandfed.org/Research/PolicyDis/No7Nov04.pdf
1 =
Clipboard01.jpg (image)
2 –
Congratulations to Emmanuel Saez
3 =
http://www.demos.org/inequality/images/charts/uspersonalsaving_thumb.gif
3 =
U.S. Bureau of Economic Analysis (BEA)
4 =
Federated Prudent Bear Fund (A): Overview
4 =
FRB: Z.1 Release--Financial Accounts of the United States--December 10, 2015
5/6 =
15 Mind-Blowing Facts About Wealth And Inequality In America
Overview =
http://www.ourfuture.org/blog-entry/2010062415/reagan-revolution-home-roost-charts