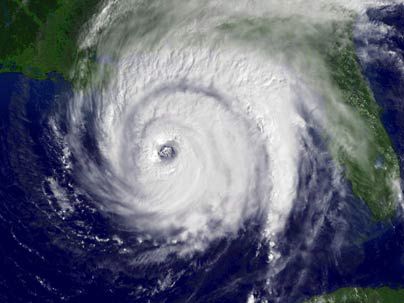
Remember Billy Boy's 22 January claim that the oceans were devoid of excess heat and there would be no El Nino in the foreseeable future?
 www.bbc.com
and the study on which this is based
 essd.copernicus.org
I wonder if he needs a do-over.
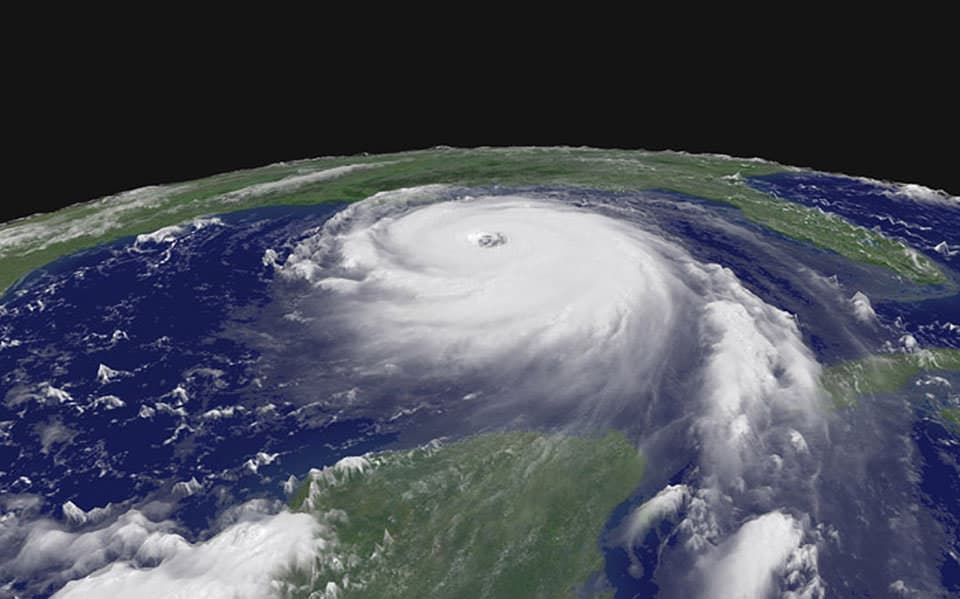
LOL... A general "we haven't a clue" forecast. Got to love it. And not one of them has looked to the regions which store heat to see if it is building in our oceans. These regions are empty of heat. This means a very weak or no El Niño for the ENSO and then back to the La Niña.
I think that NOAA is in for a big surprise when it does not form or is very weak. The energy loss above the poles is massive and they are ignoring it.
La Niña shows signs of ending. Is El Niño next? (msn.com)
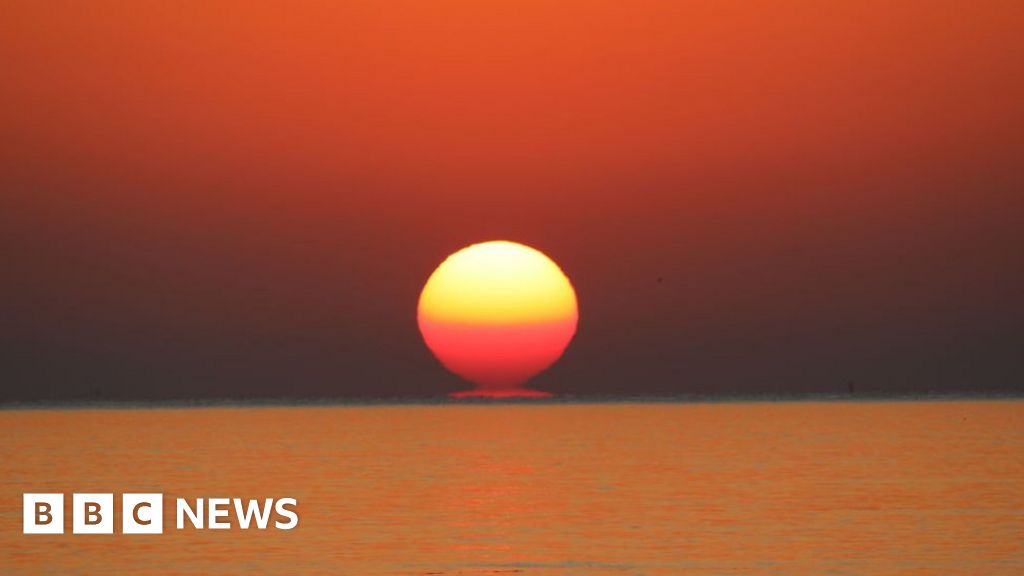
Recent, rapid ocean warming ahead of El Niño alarms scientists
There’s growing concern that the oceans are heating up quickly – and scientists are unsure of the implications.
www.bbc.com
and the study on which this is based
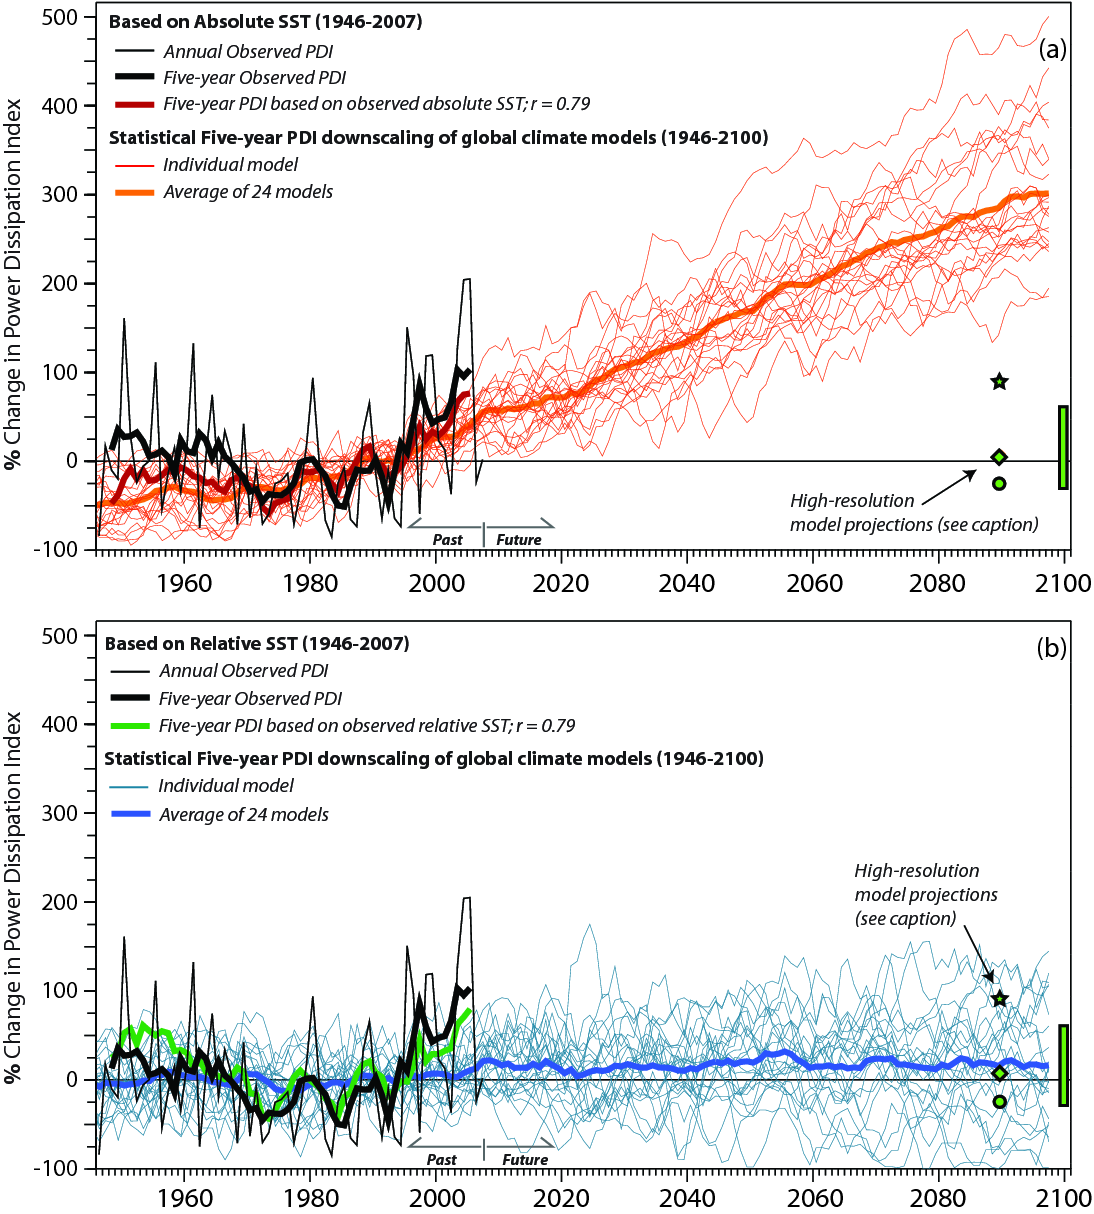
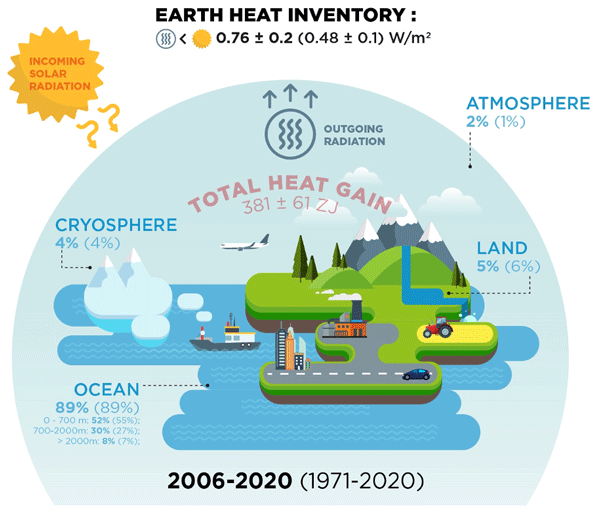
Heat stored in the Earth system 1960–2020: where does the energy go?
Abstract. The Earth climate system is out of energy balance, and heat has accumulated continuously over the past decades, warming the ocean, the land, the cryosphere, and the atmosphere. According to the Sixth Assessment Report by Working Group I of the Intergovernmental Panel on Climate Change...
I wonder if he needs a do-over.