You keep making a fool of yourself by posting more and more proof that The bi-monthly Multivariate El Niño/Southern Oscillation (ENSO) index (MEI.v2) that uses 5 variables is more accurate than your ENSO data alone.
Thank you.
Oh my your stupidity reaches galaxy class level.
Again for the THIRD time I quote:
"A new version of the MEI (MEI.v2) has been created that uses 5 variables (sea level pressure (SLP), sea surface temperature (SST), surface zonal winds (U), surface meridional winds (V), and Outgoing Longwave Radiation (OLR)) to produce a time series of ENSO conditions from 1979 to present. The MEI.v2 expands upon the original MEI developed by Wolter and Timlin (1993) which was calculated using 6 variables as proxies for ENSO relevant atmosphere and ocean conditions."
my bolding
=====================================
Then we have this from the link you keep ignoring:
The bi-monthly Multivariate El Niño/Southern Oscillation (ENSO) index (MEI.v2) is the time series of the leading combined Empirical Orthogonal Function (EOF) of five different variables (sea level pressure (SLP), sea surface temperature (SST), zonal and meridional components of the surface wind, and outgoing longwave radiation (OLR)) over the tropical Pacific basin (30°S-30°N and 100°E-70°W). The EOFs are calculated for 12 overlapping bi-monthly "seasons" (Dec-Jan, Jan-Feb, Feb-Mar,..., Nov-Dec) in order to take into account ENSO's seasonality, and reduce effects of higher frequency intraseasonal variability.
bolding mine
Here are those BI-MONTHLY data you keep ignoring:
MEI.v2 Values
This page will be updated automatically by the 10th of each month. For the period between 1979 and 2018, the ICOADS-based MEI and MEI.v2 are correlated at 0.95. Last data update: 7 January 2020
Current Value: 0.4
LINK
bolding mine
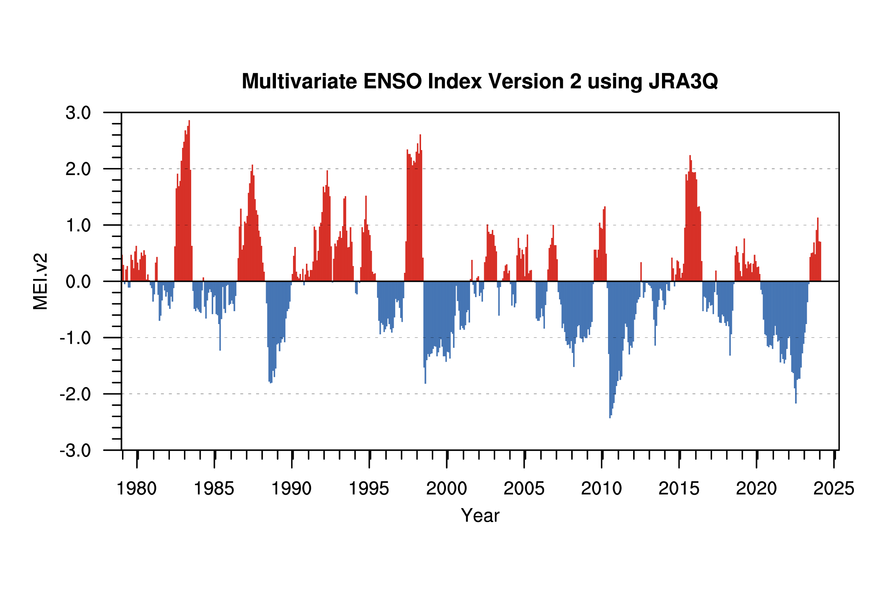
sample of the last 10 years of MEI.v2 Values from the link you keep ignoring:
YEAR DJ JF FM MA AM MJ JJ JA AS SO ON ND
2010 0.9 1.3 1.3 0.5 -0.2 -1.3 -2.4 -2.4 -2.3 -2.2 -2 -1.9
2011 -1.8 -1.6 -1.8 -1.7 -1.3 -1.1 -0.9 -0.9 -1.2 -1.4 -1.2 -1.2
2012 -1.1 -0.7 -0.6 -0.4 -0.3 -0.3 0.3 -0.1 -0.3 -0.2 -0.1 -0.1
2013 0 -0.1 -0.1 -0.4 -0.7 -1.2 -0.8 -0.5 -0.4 -0.2 -0.2 -0.3
2014 -0.5 -0.4 -0.1 -0.2 -0.2 0 0.3 0.2 -0.1 0.1 0.3 0.3
2015 0.2 0.1 0.1 0.4 1 1.9 1.7 1.9 2.2 2.1 1.9 1.9
2016 1.9 1.8 1.3 1.3 1.3 0.4 -0.5 -0.3 -0.3 -0.6 -0.5 -0.3
2017 -0.4 -0.4 -0.6 -0.2 0.2 -0.3 -0.7 -0.8 -0.8 -0.6 -0.6 -0.7
2018 -0.8 -0.7 -0.8 -1.3 -0.9 -0.5 -0.2 0.4 0.5 0.4 0.3 0.1
2019 0.1 0.5 0.8 0.3 0.3 0.4 0.2 0.3 0.2 0.3 0.5 0.4
See that 0.4 is the CURRENT value?
Those bi-monthly numbers are end result of combining the FIVE VARIABLES into a single number!
Why do you think it is called the ENSO INDEX?
To sum it up, quoting again:
"The bi-monthly Multivariate El Niño/Southern Oscillation (ENSO) index (MEI.v2)"
You finally get it?
there you go again posting data that completely contradicts your lie below using the very data I posted that you first denied and now you act like you provided it.
The last time we had a moderate La Nina was nearly 10 years ago, it has been neutral to El-Nino nearly 90% of the time since.
It sure doesn't look like it has been neutral to El-Nino nearly 90% of the time for the last 10 years, as you falsely claimed.
You keep forgetting your glasses, this is what I said several times now:
The last time we had a moderate La Nina was nearly 10 years ago, it has been neutral to El-Nino nearly 90% of the time since.
It reached moderate La Nina level a SINGLE month two times since 2012, you finally get it slow thinker? Yes there has been some weak La Nina since 2012, but I was talking about
Moderate La Nina levels, which is obvious if you actually think a little.
The key word is MODERATE!
No your key LIE is MODERATE! You said only a moderate La Nina for the last 10 years and the chart clearly shows
a very STRONG La Nina starting in 2010 and lasting to a lesser degree for 4 years.
Once again you are wrong, since the
ENSO values show that it stopped being a Moderate La-Nina after January 2012, as shown
HERE
It stopped being a La Nina in any level in MAY 2012, which means it didn't even last two years.
2010 1.5 1.3 0.9 0.4 -0.1
-0.6 -1.0 -1.4 -1.6 -1.7 -1.7 -1.6
2011 -1.4 -1.1 -0.8 -0.6 -0.5 -0.4
-0.5 -0.7 -0.9 -1.1 -1.1 -1.0
2012 -0.8 -0.6 -0.5 -0.4 -0.2 0.1 0.3 0.3 0.3 0.2 0.0 -0.2
2013 -0.4 -0.3 -0.2 -0.2 -0.3 -0.3 -0.4 -0.4 -0.3 -0.2 -0.2 -0.3
2014 -0.4 -0.4 -0.2 0.1 0.3 0.2 0.1 0.0 0.2 0.
4 0.6 0.7
2015 0.6 0.6 0.6 0.8 1.0 1.2 1.5 1.8 2.1 2.4 2.5 2.6
2016 2.5 2.2 1.7 1.0 0.5 0.0 -0.3
-0.6 -0.7 -0.7 -0.7 -0.6
2017 -0.3 -0.1 0.1 0.3 0.4 0.4 0.2 -0.1 -0.4
-0.7 -0.9 -1.0
2018 -0.9 -0.8 -0.6 -0.4 -0.1 0.1 0.1 0.2 0.4
0.7 0.9 0.8
2019 0.8 0.8 0.8 0.7 0.6 0.5 0.3 0.1 0.1 0.3 0.5
LINK
You had made this very stupid claim:
a very STRONG La Nina starting in 2010 and lasting to a lesser degree for 4 years.
By the way you make clear you are clueless in what is going on here, I gave you the links, you still don't realize how I am making a fool of you.
You need to stop here.........