Latest Global Temp. Anomaly (December '19: +0.56°C) Weak El Nino Conditions Help Explain Recent

Sunsettommy

Diamond Member
Mar 19, 2018
14,894
12,528
2,400
Global Warming

Latest Global Temp. Anomaly (December '19: +0.56°C)
Weak El Nino Conditions Help Explain Recent Global Warmth

January 13th, 2020 by Roy W. Spencer, Ph. D.

Excerpt:

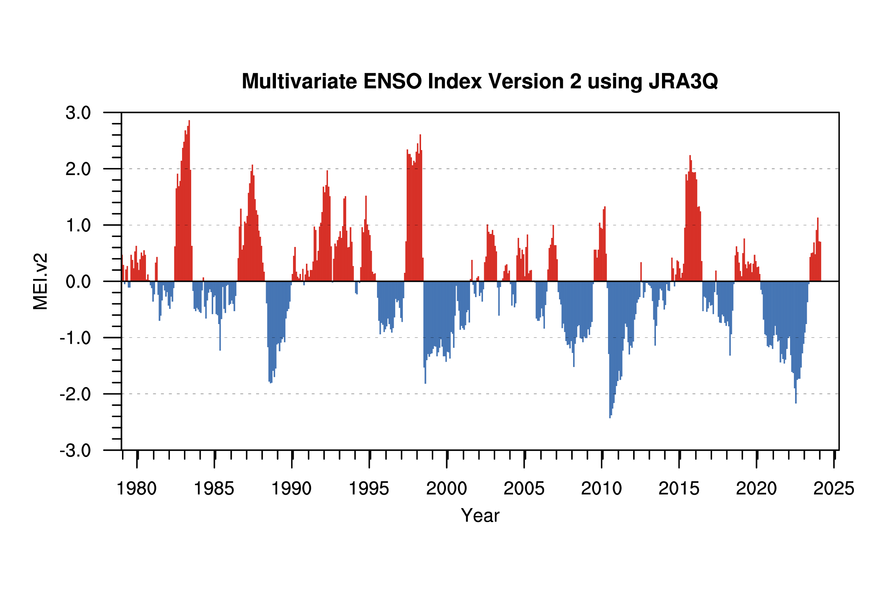
The continuing global-average warmth over the last year has caused a few people to ask for my opinion regarding potential explanations. So, I updated the 1D energy budget model I described a couple years ago here with the most recent Multivariate ENSO Index (MEIv2) data. The model is initialized in the year 1765, has two ocean layers, and is forced with the RCP6 radiative forcing scenario and the history of El Nino and La Nina activity since the late 1800s.

The result shows that the global-average (60N-60S) ocean sea surface temperature (SST) data in recent months are well explained as a reflection of continuing weak El Nino conditions, on top of a long-term warming trend.

LINK
========================

Ocean and Sun is what drives weather and climate changes.

The evidence is clear, current El-Nino is what drives the current warming, CO2 has NOTHING to do with it!


The last time we had a moderate La Nina was nearly 10 years ago, it has been neutral to El-Nino nearly 90% of the time since.

LINK
 
The evidence is clear, current El-Nino is what drives the current warming, CO2 has NOTHING to do with it!

The last time we had a moderate La Nina was nearly 10 years ago, it has been neutral to El-Nino nearly 90% of the time since.
Russia Limpboy's climatologist is a liar like him!
meiv2.timeseries.png

ENSO is not the same as El-Nino, I posted the link to the El-Nino/La Nina data, which you obviously missed.

"Cold & Warm Episodes by Season

Link to Previous Version of ONI (ERSSTv4)

Notice: This page is updated automatically on the first Thursday of each month. Because of the high frequency filter applied to the ERSSTv5 data (Huang et al. 2017, J.Climate), ONI values may change up to two months after the initial "real time" value is posted. Therefore, the most recent ONI values should be considered an estimate."

=====

But your chart supports my statement anyway, as I stated: "The last time we had a moderate La Nina was nearly 10 years ago, it has been neutral to El-Nino nearly 90% of the time since."

Your chart shows the last time a MODERATE La-Nina showed up was nearly 10 years ago. It also shows the weak El-Nino of the last few months.

Got anything else to stumble around with?
 
The evidence is clear, current El-Nino is what drives the current warming, CO2 has NOTHING to do with it!

The last time we had a moderate La Nina was nearly 10 years ago, it has been neutral to El-Nino nearly 90% of the time since.
Russia Limpboy's climatologist is a liar like him!
meiv2.timeseries.png

ENSO is not the same as El-Nino, I posted the link to the El-Nino/La Nina data, which you obviously missed.

But your chart supports my statement anyway, as I stated: "The last time we had a moderate La Nina was nearly 10 years ago, it has been neutral to El-Nino nearly 90% of the time since."

Your chart shows the last time a MODERATE La-Nina showed up was nearly 10 years ago. It also shows the weak El-Nino of the last few months.

Got anything else to stumble around with?
It was Roy Boy who cited the Multivariate ENSO Index (MEIv2) data and if you think my chart supports your lies you need your eyes examined. There is a hell of a lot more BLUE than RED in the last 10 years and that "moderate" La-Nina was the strongest since 1979!!!!
 
Now what does it look like under the RCP2.5 scenario? ... RCP6.0 has largely been abandoned except for click-bait results ... even RCP4.5 looks highly improbable unless we really get busy building fossil fuel power plants where there are none currently (about 20% of the human population has no electric grid) ... I like Roy Spencer, one of an emerging group of atmospheric scientists working to dispel the crazy myths that we find in the media ...

The second section of your post provides a link that doesn't seem back your claims ... it shows a La Nina event in 2016 and another in 2017-2018 ... and ten years is subject to the dynamic contamination ... you're making the same mistake most folks unfamiliar with the science, picking one factor as the be-all of everything ... and that's just wrong ... everything is connected to everything else ...

Remember ... the sum of periodic functions is itself a periodic function ... always ...
 
No ... the raw data doesn't support your claim ... perhaps you should better define "moderate" ... typically this means "in the middle" and clearly the 2017-2018 La Nina event is smack dab in the middle of the raw data, making it a "moderate" event ...
 
The evidence is clear, current El-Nino is what drives the current warming, CO2 has NOTHING to do with it!

The last time we had a moderate La Nina was nearly 10 years ago, it has been neutral to El-Nino nearly 90% of the time since.
Russia Limpboy's climatologist is a liar like him!
meiv2.timeseries.png

ENSO is not the same as El-Nino, I posted the link to the El-Nino/La Nina data, which you obviously missed.

But your chart supports my statement anyway, as I stated: "The last time we had a moderate La Nina was nearly 10 years ago, it has been neutral to El-Nino nearly 90% of the time since."

Your chart shows the last time a MODERATE La-Nina showed up was nearly 10 years ago. It also shows the weak El-Nino of the last few months.

Got anything else to stumble around with?
It was Roy Boy who cited the Multivariate ENSO Index (MEIv2) data and if you think my chart supports your lies you need your eyes examined. There is a hell of a lot more BLUE than RED in the last 10 years and that "moderate" La-Nina was the strongest since 1979!!!!

You are a truly lazy thinker, since I gave you the link to this chart showing the actual numbers in three month blocks, here is the last 10 years of the chart you keep ignoring/avoiding:


2010 1.5 1.3 0.9 0.4 -0.1 -0.6 -1.0 -1.4 -1.6 -1.7 -1.7 -1.6
2011 -1.4 -1.1 -0.8 -0.6 -0.5 -0.4 -0.5 -0.7 -0.9 -1.1 -1.1 -1.0
2012 -0.8 -0.6 -0.5 -0.4 -0.2 0.1 0.3 0.3 0.3 0.2 0.0 -0.2
2013 -0.4 -0.3 -0.2 -0.2 -0.3 -0.3 -0.4 -0.4 -0.3 -0.2 -0.2 -0.3
2014 -0.4 -0.4 -0.2 0.1 0.3 0.2 0.1 0.0 0.2 0.4 0.6 0.7
2015 0.6 0.6 0.6 0.8 1.0 1.2 1.5 1.8 2.1 2.4 2.5 2.6
2016 2.5 2.2 1.7 1.0 0.5 0.0 -0.3 -0.6 -0.7 -0.7 -0.7 -0.6
2017 -0.3 -0.1 0.1 0.3 0.4 0.4 0.2 -0.1 -0.4 -0.7 -0.9 -1.0
2018 -0.9 -0.8 -0.6 -0.4 -0.1 0.1 0.1 0.2 0.4 0.7 0.9 0.8
2019 0.8 0.8 0.8 0.7 0.6 0.5 0.3 0.1 0.1 0.3 0.5

LINK

====

Mostly red or neutral since the last moderate La-Nina came around over 8 years ago. Very little La-Nina since early 2012.....
 
Last edited:
No ... the raw data doesn't support your claim ... perhaps you should better define "moderate" ... typically this means "in the middle" and clearly the 2017-2018 La Nina event is smack dab in the middle of the raw data, making it a "moderate" event ...

In 2016 La-Nina was between -.06 to -0.7 clearly a very WEAK La-Nina.

In late 2017 to early 2018 it reached -1.0 for a short time otherwise spent the rest of the time in the WEAK La-Nina area between -0.6 to -0.9 clearly a weak La-Nina. Neither time did it last long or reached Moderate status.

Don't ignore the chart I linked to!
 
Last edited:
The chart you linked to doesn't show any qualitative analysis ... it's raw data ... it's up to the philosophers to decide how we characterize this data ...

You have to define "moderate" ... or your interpretation is capricious and ambiguous ... thus meaningless in any scientific context ...

I'll leave it to you to calculate the standard deviation, and then express your qualitative analyses in terms of this ... if your "very weak" definition turns out to be a single deviation, then please note that ... and realize that's a very non-standard definition ...

You are running on bullshit since Dr. Spencer already posted this and editcynic posted again this chart:

meiv2.timeseries.png


Overview

The El Niño/Southern Oscillation (ENSO) - a naturally occurring anomalous state of tropical Pacific coupled ocean-atmosphere conditions - is the primary predictor for global climate disruptions. These can persist over several seasons and thereby produce severe regional effects. An appraisal of the real-time status of ENSO is thus important for a host of climate services that inform societal responses and trigger policy actions for water supply, food security, health, and public safety. The MEI, which combines both oceanic and atmospheric variables, facilitates in a single index an assessment of ENSO. It especially gives real-time indications of ENSO intensity, and through historical analysis - provides a context for meaningful comparative study of evolving conditions. The bi-monthly Multivariate El Niño/Southern Oscillation (ENSO) index (MEI.v2) is the time series of the leading combined Empirical Orthogonal Function (EOF) of five different variables (sea level pressure (SLP), sea surface temperature (SST), zonal and meridional components of the surface wind, and outgoing longwave radiation (OLR)) over the tropical Pacific basin (30°S-30°N and 100°E-70°W). The EOFs are calculated for 12 overlapping bi-monthly "seasons" (Dec-Jan, Jan-Feb, Feb-Mar,..., Nov-Dec) in order to take into account ENSO's seasonality, and reduce effects of higher frequency intraseasonal variability.


LINK

bolding mine

==========

Methods

A new version of the MEI (MEI.v2) has been created that uses 5 variables (sea level pressure (SLP), sea surface temperature (SST), surface zonal winds (U), surface meridional winds (V), and Outgoing Longwave Radiation (OLR)) to produce a time series of ENSO conditions from 1979 to present. The MEI.v2 expands upon the original MEI developed by Wolter and Timlin (1993) which was calculated using 6 variables as proxies for ENSO relevant atmosphere and ocean conditions.

LINK
=====

Here is a link showing only a TWO month block (NOAA shows a THREE month block) there it shows that La-Nino reached moderate level for just a single two month block.

LINK

March/April -1.3

=====

The MEI Version 2 chart isn't raw data........


You are embarrassing yourself here.....
 
So ... you don't know how to calculate standard deviation ... it's math, maybe that's the problem ... eh? ...

This is the topic:

Weak El Nino Conditions Help Explain Recent Global Warmth

So you don't that you realize you are being made a fool of here, your standard deviation argument is a STRAW MAN and a RED HERRING all in a single sentence attempt, kindly FUCK OFF!

Logical fallacy
As an informal fallacy, the red herring falls into a broad class of relevance fallacies. Unlike the straw man, which involves a distortion of the other party's position,[2] the red herring is a seemingly plausible, though ultimately irrelevant, diversionary tactic.[3] According to the Oxford English Dictionary, a red herring may be intentional, or unintentional; it is not necessarily a conscious intent to mislead.

The expression is mainly used to assert that an argument is not relevant to the issue being discussed. For example, "I think we should make the academic requirements stricter for students. I recommend you support this because we are in a budget crisis, and we do not want our salaries affected." The second sentence, though used to support the first sentence, does not address that topic.

It is clear you have no argument to make on what I actually posted......., you never did explain your weak vs. moderate argument at all (I did several times), and nothing about raw data being presented into a final product (represented by the ENSO chart you keep misunderstanding) which has been long recognized as sufficient. You were shown what data is used to make the chart up, you ignored it.....

Take your shit elsewhere.....
 
The evidence is clear, current El-Nino is what drives the current warming, CO2 has NOTHING to do with it!

The last time we had a moderate La Nina was nearly 10 years ago, it has been neutral to El-Nino nearly 90% of the time since.
Russia Limpboy's climatologist is a liar like him!
meiv2.timeseries.png

ENSO is not the same as El-Nino, I posted the link to the El-Nino/La Nina data, which you obviously missed.

But your chart supports my statement anyway, as I stated: "The last time we had a moderate La Nina was nearly 10 years ago, it has been neutral to El-Nino nearly 90% of the time since."

Your chart shows the last time a MODERATE La-Nina showed up was nearly 10 years ago. It also shows the weak El-Nino of the last few months.

Got anything else to stumble around with?
It was Roy Boy who cited the Multivariate ENSO Index (MEIv2) data and if you think my chart supports your lies you need your eyes examined. There is a hell of a lot more BLUE than RED in the last 10 years and that "moderate" La-Nina was the strongest since 1979!!!!

You are a truly lazy thinker, since I gave you the link to this chart showing the actual numbers in three month blocks, here is the last 10 years of the chart you keep ignoring/avoiding:


2010 1.5 1.3 0.9 0.4 -0.1 -0.6 -1.0 -1.4 -1.6 -1.7 -1.7 -1.6
2011 -1.4 -1.1 -0.8 -0.6 -0.5 -0.4 -0.5 -0.7 -0.9 -1.1 -1.1 -1.0
2012 -0.8 -0.6 -0.5 -0.4 -0.2 0.1 0.3 0.3 0.3 0.2 0.0 -0.2
2013 -0.4 -0.3 -0.2 -0.2 -0.3 -0.3 -0.4 -0.4 -0.3 -0.2 -0.2 -0.3
2014 -0.4 -0.4 -0.2 0.1 0.3 0.2 0.1 0.0 0.2 0.4 0.6 0.7
2015 0.6 0.6 0.6 0.8 1.0 1.2 1.5 1.8 2.1 2.4 2.5 2.6
2016 2.5 2.2 1.7 1.0 0.5 0.0 -0.3 -0.6 -0.7 -0.7 -0.7 -0.6
2017 -0.3 -0.1 0.1 0.3 0.4 0.4 0.2 -0.1 -0.4 -0.7 -0.9 -1.0
2018 -0.9 -0.8 -0.6 -0.4 -0.1 0.1 0.1 0.2 0.4 0.7 0.9 0.8
2019 0.8 0.8 0.8 0.7 0.6 0.5 0.3 0.1 0.1 0.3 0.5

LINK

====

Mostly red or neutral since the last moderate La-Nina came around over 8 years ago. Very little La-Nina since early 2012.....
Actually there is more BLUE than RED in your own chart so it is NOT mostly red or neutral but mostly BLUE or neutral.
But again your chart is NOT the data Roy Boy cited, but mine is!
 
The bi-monthly Multivariate El Niño/Southern Oscillation (ENSO) index (MEI.v2) is the time series of the leading combined Empirical Orthogonal Function (EOF) of five different variables (sea level pressure (SLP), sea surface temperature (SST), zonal and meridional components of the surface wind, and outgoing longwave radiation (OLR)) over the tropical Pacific basin (30°S-30°N and 100°E-70°W). The EOFs are calculated for 12 overlapping bi-monthly "seasons" (Dec-Jan, Jan-Feb, Feb-Mar,..., Nov-Dec) in order to take into account ENSO's seasonality, and reduce effects of higher frequency intraseasonal variability.
Why didn't you bold this??Because you didn't want to admit that Roy Boy says my chart is more accurate than your's

BWAHAHAHAHAHA!!!

The MEI Version 2 chart are BASED on the data, it is right here, THEIR LINK!

This page will be updated automatically by the 10th of each month. For the period between 1979 and 2018, the ICOADS-based MEI and MEI.v2 are correlated at 0.95. Last data update: 7 January 2020

=====

Heck you can DOWNLOAD the data

=====

and THIS you have been shown already:

The bi-monthly Multivariate El Niño/Southern Oscillation (ENSO) index (MEI.v2) is the time series of the leading combined Empirical Orthogonal Function (EOF) of five different variables (sea level pressure (SLP), sea surface temperature (SST), zonal and meridional components of the surface wind, and outgoing longwave radiation (OLR)) over the tropical Pacific basin (30°S-30°N and 100°E-70°W).

======

already told you what that data is they use to build it with:

A new version of the MEI (MEI.v2) has been created that uses 5 variables (sea level pressure (SLP), sea surface temperature (SST), surface zonal winds (U), surface meridional winds (V), and Outgoing Longwave Radiation (OLR)) to produce a time series of ENSO conditions from 1979 to present. The MEI.v2 expands upon the original MEI developed by Wolter and Timlin (1993) which was calculated using 6 variables as proxies for ENSO relevant atmosphere and ocean conditions.

You should stop now, your stupidity is off the charts, I can't find a bigger one for you.
 
Thank you for the argumentum ad hominem ... you agree my arguments are unassailable and have nothing left but my person to attack ...

You fit this post to a tee:

"2. Changing the subject: debater is losing so he tries to redirect the attention of the audience to another subject area where he thinks he can look better relative to the person he is debating, but admits to no change of subject and pretends to be refuting the original on-subject statement of his opponent. Political people on TV often use the phrase “But the real question is___” or “What the American people are really interested in is___” as a preface to changing the subject.


Two intellectually-honest tactics
There are only two intellectually-honest debate tactics:

1. pointing out errors or omissions in your opponent’s facts
2. pointing out errors or omissions in your opponent’s logic"

You didn't do either one since you have been off topic the entire time.


You are being dishonest since the article, nor myself talked about Standard deviation stuff at all, It is irrelevant, you ignored the article itself in your dishonest pursuit in pushing a RED HERRING on me, that is why I said fuck off!
 
The bi-monthly Multivariate El Niño/Southern Oscillation (ENSO) index (MEI.v2) is the time series of the leading combined Empirical Orthogonal Function (EOF) of five different variables (sea level pressure (SLP), sea surface temperature (SST), zonal and meridional components of the surface wind, and outgoing longwave radiation (OLR)) over the tropical Pacific basin (30°S-30°N and 100°E-70°W). The EOFs are calculated for 12 overlapping bi-monthly "seasons" (Dec-Jan, Jan-Feb, Feb-Mar,..., Nov-Dec) in order to take into account ENSO's seasonality, and reduce effects of higher frequency intraseasonal variability.
Why didn't you bold this??Because you didn't want to admit that Roy Boy says my chart is more accurate than your's

BWAHAHAHAHAHA!!!

The MEI Version 2 chart are BASED on the data, it is right here, THEIR LINK!

This page will be updated automatically by the 10th of each month. For the period between 1979 and 2018, the ICOADS-based MEI and MEI.v2 are correlated at 0.95. Last data update: 7 January 2020

=====

Heck you can DOWNLOAD the data

=====

and THIS you have been shown already:

The bi-monthly Multivariate El Niño/Southern Oscillation (ENSO) index (MEI.v2) is the time series of the leading combined Empirical Orthogonal Function (EOF) of five different variables (sea level pressure (SLP), sea surface temperature (SST), zonal and meridional components of the surface wind, and outgoing longwave radiation (OLR)) over the tropical Pacific basin (30°S-30°N and 100°E-70°W).

======

already told you what that data is they use to build it with:

A new version of the MEI (MEI.v2) has been created that uses 5 variables (sea level pressure (SLP), sea surface temperature (SST), surface zonal winds (U), surface meridional winds (V), and Outgoing Longwave Radiation (OLR)) to produce a time series of ENSO conditions from 1979 to present. The MEI.v2 expands upon the original MEI developed by Wolter and Timlin (1993) which was calculated using 6 variables as proxies for ENSO relevant atmosphere and ocean conditions.

You should stop now, your stupidity is off the charts, I can't find a bigger one for you.
You keep making a fool of yourself by posting more and more proof that The bi-monthly Multivariate El Niño/Southern Oscillation (ENSO) index (MEI.v2) that uses 5 variables is more accurate than your ENSO data alone.
Thank you.
 
"2. Changing the subject: debater is losing so he tries to redirect the attention of the audience to another subject area where he thinks he can look better relative to the person he is debating, but admits to no change of subject and pretends to be refuting the original on-subject statement of his opponent. Political people on TV often use the phrase “But the real question is___” or “What the American people are really interested in is___” as a preface to changing the subject.
Pure projection!
 
The bi-monthly Multivariate El Niño/Southern Oscillation (ENSO) index (MEI.v2) is the time series of the leading combined Empirical Orthogonal Function (EOF) of five different variables (sea level pressure (SLP), sea surface temperature (SST), zonal and meridional components of the surface wind, and outgoing longwave radiation (OLR)) over the tropical Pacific basin (30°S-30°N and 100°E-70°W). The EOFs are calculated for 12 overlapping bi-monthly "seasons" (Dec-Jan, Jan-Feb, Feb-Mar,..., Nov-Dec) in order to take into account ENSO's seasonality, and reduce effects of higher frequency intraseasonal variability.
Why didn't you bold this??Because you didn't want to admit that Roy Boy says my chart is more accurate than your's

BWAHAHAHAHAHA!!!

The MEI Version 2 chart are BASED on the data, it is right here, THEIR LINK!

This page will be updated automatically by the 10th of each month. For the period between 1979 and 2018, the ICOADS-based MEI and MEI.v2 are correlated at 0.95. Last data update: 7 January 2020

=====

Heck you can DOWNLOAD the data

=====

and THIS you have been shown already:

The bi-monthly Multivariate El Niño/Southern Oscillation (ENSO) index (MEI.v2) is the time series of the leading combined Empirical Orthogonal Function (EOF) of five different variables (sea level pressure (SLP), sea surface temperature (SST), zonal and meridional components of the surface wind, and outgoing longwave radiation (OLR)) over the tropical Pacific basin (30°S-30°N and 100°E-70°W).

======

already told you what that data is they use to build it with:


You should stop now, your stupidity is off the charts, I can't find a bigger one for you.
You keep making a fool of yourself by posting more and more proof that The bi-monthly Multivariate El Niño/Southern Oscillation (ENSO) index (MEI.v2) that uses 5 variables is more accurate than your ENSO data alone.
Thank you.

Oh my your stupidity reaches galaxy class level.

Again for the THIRD time I quote:

"A new version of the MEI (MEI.v2) has been created that uses 5 variables (sea level pressure (SLP), sea surface temperature (SST), surface zonal winds (U), surface meridional winds (V), and Outgoing Longwave Radiation (OLR)) to produce a time series of ENSO conditions from 1979 to present. The MEI.v2 expands upon the original MEI developed by Wolter and Timlin (1993) which was calculated using 6 variables as proxies for ENSO relevant atmosphere and ocean conditions."

my bolding

=====================================

Then we have this from the link you keep ignoring:

The bi-monthly Multivariate El Niño/Southern Oscillation (ENSO) index (MEI.v2) is the time series of the leading combined Empirical Orthogonal Function (EOF) of five different variables (sea level pressure (SLP), sea surface temperature (SST), zonal and meridional components of the surface wind, and outgoing longwave radiation (OLR)) over the tropical Pacific basin (30°S-30°N and 100°E-70°W). The EOFs are calculated for 12 overlapping bi-monthly "seasons" (Dec-Jan, Jan-Feb, Feb-Mar,..., Nov-Dec) in order to take into account ENSO's seasonality, and reduce effects of higher frequency intraseasonal variability.


bolding mine

Here are those BI-MONTHLY data you keep ignoring:


MEI.v2 Values
This page will be updated automatically by the 10th of each month. For the period between 1979 and 2018, the ICOADS-based MEI and MEI.v2 are correlated at 0.95. Last data update: 7 January 2020
Current Value: 0.4

LINK

bolding mine

sample of the last 10 years of MEI.v2 Values from the link you keep ignoring:

YEAR DJ JF FM MA AM MJ JJ JA AS SO ON ND
2010 0.9 1.3 1.3 0.5 -0.2 -1.3 -2.4 -2.4 -2.3 -2.2 -2 -1.9
2011 -1.8 -1.6 -1.8 -1.7 -1.3 -1.1 -0.9 -0.9 -1.2 -1.4 -1.2 -1.2
2012 -1.1 -0.7 -0.6 -0.4 -0.3 -0.3 0.3 -0.1 -0.3 -0.2 -0.1 -0.1
2013 0 -0.1 -0.1 -0.4 -0.7 -1.2 -0.8 -0.5 -0.4 -0.2 -0.2 -0.3
2014 -0.5 -0.4 -0.1 -0.2 -0.2 0 0.3 0.2 -0.1 0.1 0.3 0.3
2015 0.2 0.1 0.1 0.4 1 1.9 1.7 1.9 2.2 2.1 1.9 1.9
2016 1.9 1.8 1.3 1.3 1.3 0.4 -0.5 -0.3 -0.3 -0.6 -0.5 -0.3
2017 -0.4 -0.4 -0.6 -0.2 0.2 -0.3 -0.7 -0.8 -0.8 -0.6 -0.6 -0.7
2018 -0.8 -0.7 -0.8 -1.3 -0.9 -0.5 -0.2 0.4 0.5 0.4 0.3 0.1
2019 0.1 0.5 0.8 0.3 0.3 0.4 0.2 0.3 0.2 0.3 0.5 0.4

See that 0.4 is the CURRENT value?

Those bi-monthly numbers are end result of combining the FIVE VARIABLES into a single number!

Why do you think it is called the ENSO INDEX?

To sum it up, quoting again:

"The bi-monthly Multivariate El Niño/Southern Oscillation (ENSO) index (MEI.v2)"

You finally get it?

 
Last edited:

Forum List

Back
Top