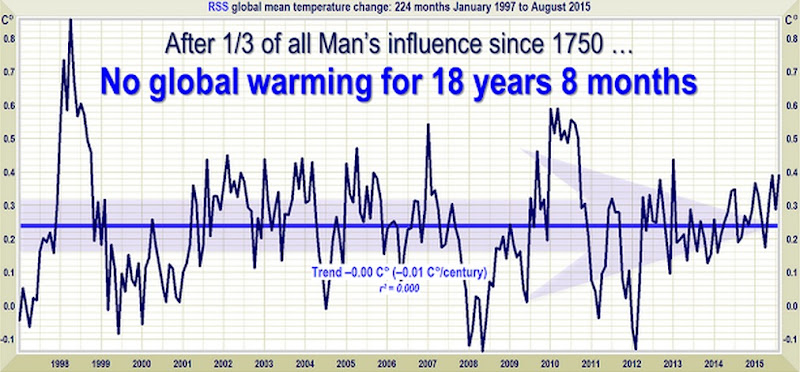
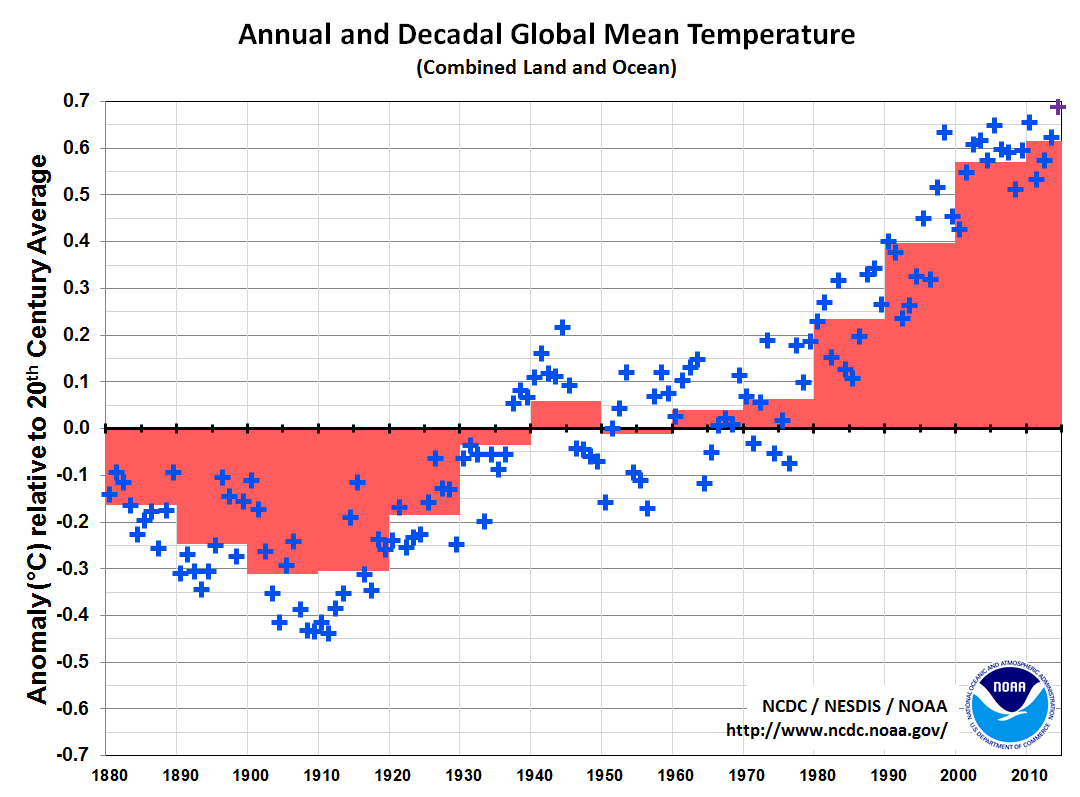
RSS data is upper atmosphere. It is NOT the global temperature. The global temperature has done this:
RSS data is 0-150 feet above ground and depending on what channel you use upwards of 60,000 feet. The OP clearly used ground level data.
Funny you would use the highly adjusted data sets... and ignore the data near ground... not surprising however....
From Wikipedia on RSS
Remote Sensing Systems (
RSS) is a private research company founded in 1974 by
Frank Wentz. It processes microwave data from a variety of
NASA satellites. Most of their research is supported by the
Earth Science Enterprise program. The company is based in
Santa Rosa, California.
They are a widely cited source of data, on the
satellite temperature record. Their data is one source of evidence for
global warming. Research by
Carl Mears, Matthias Schabel, and Wentz, all of RSS,
highlighted errors in the early satellite temperature records complied by John Christy and Roy Spencer at UAH. The
UAH data had previously showed no significant temperature trend, bringing the derived satellite data into closer agreement with surface temperature trends, radiosonde data and computer models.
[1] The
UAH data is now closer to the RSS data but differences remain, for example the
Lower Troposphere global average trend since 1979, RSS currently have
+0.133K/decade while UAH have 0.140K/decade, while the
mid troposphere difference is even more marked at
0.079K/decade and 0.052K/decade respectively.
[2][3] However, in a recent online YouTube video, Dr. Carl Mears, a senior scientist with the team behind the satellite data, explained how he believes his data set needed correction.
[4]
I would have to say that the surface data seems that it’s more accurate, because a number of groups analyze the surface data, including some who set out to prove the other ones wrong, and
they all get more or less the same answer.
References
- Andrew Revkin (November 18, 2003). "New View of Data Supports Human Link to Global Warming". New York Times. Retrieved November 6, 2009.
- "RSS / MSU and AMSU Data / Description". Retrieved 26 February 2011.
- "MONTHLY MEANS OF LOWER TROPOSPHERE LT5.4". UAH. Retrieved 26 February 2011.
- Ronson, J. Ted Cruz Gets His Comeuppance for Cherry-Picked Climate Change Data:A better understanding of the scientific method might have saved him the embarrassment. Inverse. March 3, 2016. Accessed March 4, 2016
Effects of orbital decay on satellite-derived lower-tropospheric temperature trends : Abstract : Nature Wentz, Frank J., and Matthias C. Schabel. "Effects of orbital decay on satellite-derived lower-tropospheric temperature trends." Nature 394.6694 (1998): 661-664.
Precise climate monitoring using complementary satellite data sets : Abstract : Nature Wentz, Frank J., and Matthias C. Schabel. "Precise climate monitoring using complementary satellite data sets." Nature 403.6768 (2000): 414-416.
**********************************************************************************
So
1) Show us where it is stated that the data you presented come from the surface.
2) Explain why the people producing those data say they have a positive trend.