View attachment 907589
=========================
2006 College & University
Guidance, Scholarships, Money and Info Gateways
(For Students, Parents, College Advisors, Mentors,
and Cultural Groups)
==========================
SAT and ACT Scores by Race/Ethnicity: 2003
In recent years the noted pattern of test scores has reflected similar numbers--
Editor, 2005
SAT Ethnic Group Scores (Math/Verbal+total)
• American Indian---482/480 (962)
• Asian American-----575/508 (1083)
• African American-----426/431 (857)
• Puerto Rican----457/448 (905)
Other Hispanic----464/457 (921)
• White-----534/529 (1063)
• Other ----513/501 (1014)
Source:
www.collegeboard.com
Average ACT Composite Score by Race/Ethnicity, 2003
----------------------------------------------------
• African American ----16.9
• American Indian---18.7
• Caucasian---- 21.7
• Mexican American----18.3
• Asian American---- 21.8
• Hispanic----19.0
• Other ----19.3
• Multiracial-----20.9
• Prefer Not to Respond -----21.8
• No Response-----20.1
Source:
www.act.org
SAT and ACT Scores broken down by Race/Ethnicity.
www.blackexcel.org
Race and crime in the United States
According to the
FBI 2019 Uniform Crime Report, African-Americans accounted for 55.9% of all homicide offenders in 2019, with whites 41.1%...
According to the
National Crime Victimization Survey in 2002, robberies with white victims and black offenders were more than 12 times more common than the opposite
According to the FBI Uniform Crime Reports, in 2008, black youths, who make up 16% of the youth population, accounted for 52% of juvenile violent crime arrests, including 58.5% of youth arrests for homicide and 67% for robbery. Black youths were overrepresented in all offense categories except DUI, liquor laws, and drunkenness...
According to the
National Crime Victimization Survey in 2002, robberies with white victims and black offenders were more than 12 times more common than the opposite...
Hindelang's analysis found that both the NCS and UCR estimated that 62% of robbery offenders were black in the United States in 1974.
[59]: 327 A 2004 National Crime Victimization Survey report which analyzed
carjacking over 10 years found that carjacking victims identified 56% of offenders as black

en.wikipedia.org
-------------
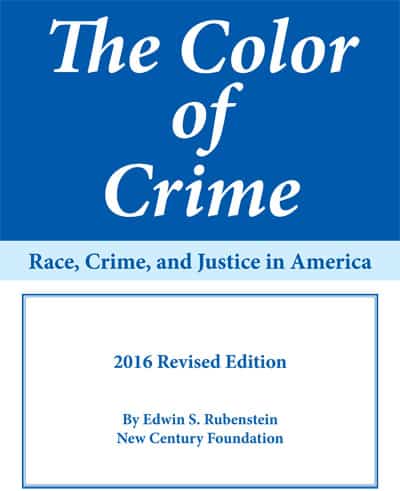
The Color of Crime: Race, Crime, and Justice in America, by Edwin S. Rubenstein, New Century Foundation
- There are dramatic race differences in crime rates. Asians have the lowest rates, followed by whites, and then Hispanics. Blacks have notably high crime rates. This pattern holds true for virtually all crime categories and for virtually all age groups.
- In 2013, a black was six times more likely than a nonblack to commit murder, and 12 times more likely to murder someone of another race than to be murdered by someone of another race.
In 2013, of the approximately 660,000 crimes of interracial violence that involved blacks and whites, blacks were the perpetrators 85 percent of the time. This meant a black person was 27 times more likely to attack a white person than vice versa.
New Century Foundation is a 501(c)(3) organization founded in 1994 to study immigration and race relations so as to better understand the consequences of America’s increasing diversity. Perhaps the most important publication of New Century Foundation is “The Color of Crime,” New Century...

www.amren.com
-------------
Center for Equal Opportunity
Percentage of Births to Unmarried Women
ROGER CLEGG FEBRUARY 26, 2020
For all racial and ethnic groups combined, 39.6 percent of births in the United States were out-of-wedlock (incidentally, isn’t that appalling?). And there was as always a tremendous range among groups. For blacks, the number is 69.4 percent; for American Indians/Alaska Natives, 68.2 percent (Native Hawaiians/Other Pacific Islanders were at 50.4 percent); for Hispanics, 51.8 percent; for whites, 28.2 percent; and for Asian Americans, a paltry 11.7 percent.

www.ceousa.org