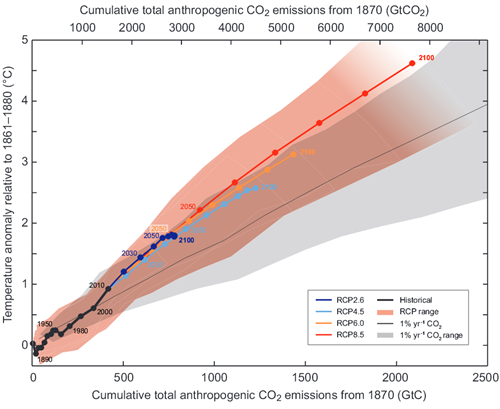
Figure 1: Increase of the mean Earth’s surface temperature as a function of the cumulative global CO2 emissions. Mean values calculated from multiple simulations using several carbon cycle models are shown until year 2100 for each RCP (color lines). Circles mark decadal means and for clarity selected decadal means were labeled with appropriate color matching text (e.g., 2050 indicates the decade 2040-2049). Black line denotes model results over the historical period (1860-2010). Shaded areas illustrate range of model results for various RCP scenarios. Black narrow line and grey shaded area show, respectively, the mean and the range of simulation results using many models CMIP5 assuming CO2 concentration growth of 1% per year. For a given value of cumulative CO2emissions, simulations assuming 1% yearly concentration growth show smaller temperature increase than simulations corresponding to RCP, which include other forcings besides CO2. Temperature change is relative to the base period 1861-1881. Decadal averages are connected by straight lines. Source:
5th IPCC report.
Does that look logarithmic to you?
If growth of CO2 concentration causes only logarithmic temperature increase - why worry?