You need to at least make an effort to estimate the actual span of time that rise took. I will print it and take a ruler and see what I get. My initial estimate was done with a couple sheets of paper for a straight edge just working off my screen.
Okay, I used the snip tool to grab that graph and then used its markup tools to draw some lines on the graph to mark out that rise.
View attachment 748436
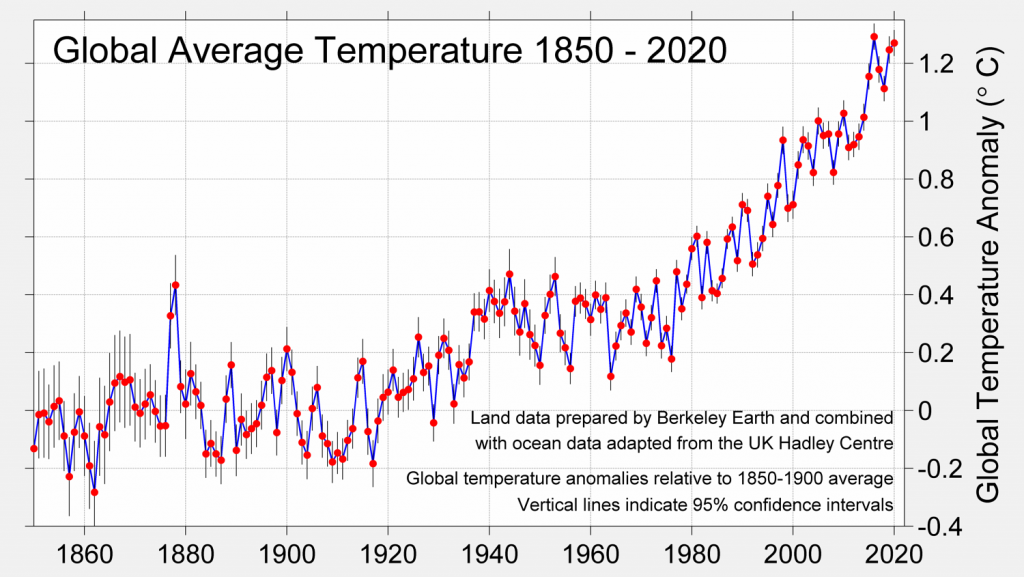
I took a ruler and measured very carefully and came up with a 12.6 degree rise over 8,888 years. That's a rate of 1.42 degrees/millenia. If we use the graph that goes from 1850 to 2020 and just use the endpoints, we can get some numbers without that much hassle. Now this, of course, ignores the significant acceleration warming has undergone in the last century or so. Be that as it may, the graph looks like this:
So, that shows 1.2 degrees from 1850 to 2020. 1.2 degrees/170 years. That's 7.06 degrees/millenia, or 5 TIMES the warming rate. If we use 1980 to 2020 we would get 0.8 degrees/40 years or 20 degrees/millenia, 14 TIMES the rate. Current warming is many times faster than at any point in the history of homo sapiens and, in fact, in probably over a million years. That's not natural. That's not commonplace. That's not something that should be ignored.