Forget Climategate: this ‘global warming’ scandal is much bigger

But aren't there also supposed to be cooling phases? There has been no real cooling phase for the past 100 years. There are warming phases followed by flat phases followed by warming phases starting just about where the previous warming phase left off. Something is interfering with the cold cycle the last 100 years. What do you suppose it is?
well the previous cooling phase before the current one was 1940 to 1970. I believe that to be under 100 years.
Not a cooling phase at all. A flat phase, yes, but not a cooling phase. A warming phase started in 1910 and flattened out by 1940. The "cooling" you claim never got near the 1910 low and by 1980 was at about the same place where the warming flattened out in 1940. We are flat again now with no cooling in sight, especially to the 1910 levels. In fact this flat cycle is even flatter then the previous flat cycle.

201301-201312.png
nope 1940 t0 1970.

link,Climate myths The cooling after 1940 shows CO2 does not cause warming - environment - 16 May 2007 - New Scientist

dn11639-2_250.jpg


I see what they're doing everyone, they're adjusting the data to take out the cooling phases to show something than what actually happened. I'd call that an easy button.
 
Last edited:
Describe what you see in these graphs ed.
Geeezzzz, how thick are you, I already spelled it out for you, what do you not understand????? I've just highlighted it in red to help you!
Based on what trends ed?
The same exact trends you claim were in ONLY gone direction.
You are obviously not man enough to admit your claim had no basis in fact!
Thank you.
No, I'm looking at what you present and the presentation I see is a global climate model. I see nothing that has to do with the adjustments of the weather stations. We are talking about the local station data that is being altered. Not the global that you present here.
You "see" only what you want to see. Those charts are not models, they are the actual local station data from V2 and V3. It was the change from V2 to V3 that you deniers falsely claim is what altered the data in ONE direction ONLY. The left chart is V2 for the indicated years local data, the middle chart is V3 for the same years, and the third chart is the amount of change and in what direction positive or negative from V2 to V3 for each locale across the globe for the same years.
i don't want to see fudged data thank you. So V2 data only.
What you are really saying is that you don't want to see reality. And are willing to endanger the lives of our descendents so you can live in your imaginery universe.
i'm endangering no one. You on the other hand will wipe out the poor with your path. BTW, eleven dead in the chicago area this month from the cold. So, not sure how I'm endangering anything. mother nature does it on her own. Or do you think you can control weather?
 
But aren't there also supposed to be cooling phases? There has been no real cooling phase for the past 100 years. There are warming phases followed by flat phases followed by warming phases starting just about where the previous warming phase left off. Something is interfering with the cold cycle the last 100 years. What do you suppose it is?
well the previous cooling phase before the current one was 1940 to 1970. I believe that to be under 100 years.
Not a cooling phase at all. A flat phase, yes, but not a cooling phase. A warming phase started in 1910 and flattened out by 1940. The "cooling" you claim never got near the 1910 low and by 1980 was at about the same place where the warming flattened out in 1940. We are flat again now with no cooling in sight, especially to the 1910 levels. In fact this flat cycle is even flatter then the previous flat cycle.

201301-201312.png
nope 1940 t0 1970.

link,Climate myths The cooling after 1940 shows CO2 does not cause warming - environment - 16 May 2007 - New Scientist

dn11639-2_250.jpg


I see what they're doing everyone, they're adjusting the data to take out the cooling phases to show something than what actually happened. I'd call that an easy button.
Your chart shows a .6 degree C warming from 1910 to 1940, then a .2 C cooling from 1940 to 1950 and then another .6C warming from 1950 to 2000, so there was a slight cooling over only 10 years no 30 year cooling.

dn11639-2_808.jpg
 
i don't want to see fudged data thank you. So V2 data only.


that is tooooooo funny1 version 2 data is also massively adjusted but it certainly looks better than the travesty of version 3
 
i don't want to see fudged data thank you. So V2 data only.


that is tooooooo funny1 version 2 data is also massively adjusted but it certainly looks better than the travesty of version 3
V3 data is the most accurate, but deniers only accept data that agrees with their religion, no matter how inaccurate.


hahahaha. the most accurate what??? last year we were told that the algorithms were performing as expected. I suppose that may be true but an accurate temperature history is not what we are getting.

over the last few weeks I have read a lot of the explanations from people like Zeke, Stokes, Venema, etc and they all sound rather soothing but they never seem to answer specific questions. they make a lot of generalized statements that could be taken in many ways.


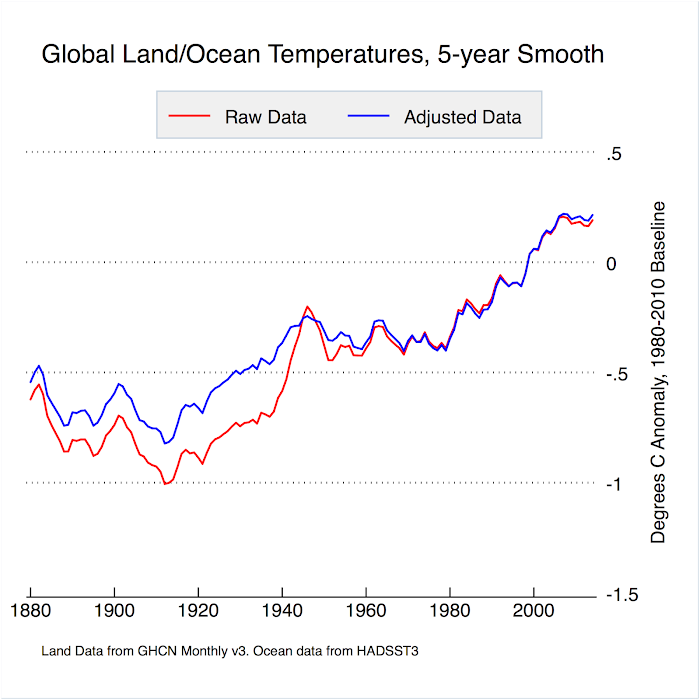
I love their new meme that they want to get established. "The adjustments actually reduce the warming trend so why dont you trust us?". see?, look at our graph

land%2Bocean%2Braw%2Badj.png
 
Stokes has his own story-
records aren't adjusted in the belief that thermometers were read incorrectly. They are usually adjusted specifically for the calculation of a regional average. Station records are used as representative of a region. When something happens that is not climate-based, then it isn't representative of the region.

so we shouldnt expect a station temperature record to actually match the data collected. except perhaps if it matches what is expected to be found.

But sometimes a definite error shows up. There may have been one at Reykjavik. Part of a temperature dip was wrongly considered an inhomogeneity. So should it be fixed?
No! As noted above, a good algorithm has been tested for lack of bias. If you start intervening, it loses that property. Noise won't hurt the average, but taking out the bits that displease naysayers certainly will.

so, obvious errors dont matter. and fixing problems would upset the algorithm. allllllllrighty then. well we wouldnt want to piss off the computer code would we?
 
from Zeke's explanation over at Judith Curry's blog-

figure-7-homogenizationtrend1900.png


with every new layer of adjustments the variation becomes less and less. everything is modified to match expectations.
 
But aren't there also supposed to be cooling phases? There has been no real cooling phase for the past 100 years. There are warming phases followed by flat phases followed by warming phases starting just about where the previous warming phase left off. Something is interfering with the cold cycle the last 100 years. What do you suppose it is?
well the previous cooling phase before the current one was 1940 to 1970. I believe that to be under 100 years.
Not a cooling phase at all. A flat phase, yes, but not a cooling phase. A warming phase started in 1910 and flattened out by 1940. The "cooling" you claim never got near the 1910 low and by 1980 was at about the same place where the warming flattened out in 1940. We are flat again now with no cooling in sight, especially to the 1910 levels. In fact this flat cycle is even flatter then the previous flat cycle.

201301-201312.png
What I see is the cyclical trend that correlates to the 160 year solar cycle, Of which we only have about 80% of. Our recent hiatus of warming can be attributed to the top of the cycle as well as the average warmth of our records to date. What we are about to enter is the cooling phase which should last about 60-100 years. You alarmists are in for a really big let down emotionally and physically as the earth cools.
That is the same argument you deniers made in the 1970s with your last Ice Age prediction. How did that work out for you?

As the stop in global warming continues your dire predictions fail over and over again... What are you going to do in 5 years when the cooling trend is solidified and your lie can not be hidden further?
Doesn't it have to start cooling first before you can have a cooling trend? Don't count your chickens before they are hatched.
 
from Zeke's explanation over at Judith Curry's blog-

figure-7-homogenizationtrend1900.png


with every new layer of adjustments the variation becomes less and less. everything is modified to match expectations.
Except the adjustments have REDUCED the warming trend which goes against the expectations you deniers claim the real scientists have! All of the warmest areas have disappeared after the adjustments.
 
I love their new meme that they want to get established. "The adjustments actually reduce the warming trend so why dont you trust us?". see?, look at our graph

In the mind of the conspiracy theorist, the conspiracy is always correct, by definition. Therefore, any facts that contradict the conspiracy clearly must be faked data. Therefore, those facts that supposedly contradict the conspiracy theory instead actually prove the conspiracy theory.

And that's why denier conspiracy theorists can't be reasoned with.
 
from Zeke's explanation over at Judith Curry's blog-

figure-7-homogenizationtrend1900.png


with every new layer of adjustments the variation becomes less and less. everything is modified to match expectations.
Except the adjustments have REDUCED the warming trend which goes against the expectations you deniers claim the real scientists have! All of the warmest areas have disappeared after the adjustments.
bad data, bad data.
 
I love their new meme that they want to get established. "The adjustments actually reduce the warming trend so why dont you trust us?". see?, look at our graph

In the mind of the conspiracy theorist, the conspiracy is always correct, by definition. Therefore, any facts that contradict the conspiracy clearly must be faked data. Therefore, those facts that supposedly contradict the conspiracy theory instead actually prove the conspiracy theory.

And that's why denier conspiracy theorists can't be reasoned with.
any data that isn't corrected is bad data. the true deniers.
The deniers bitch that the data needs to be corrected or removed, like for UHI or bad placement, and when the data is corrected or removed the deniers claim there is a conspiracy to adjust data or remove stations. :cuckoo:
 
from Zeke's explanation over at Judith Curry's blog-

figure-7-homogenizationtrend1900.png


with every new layer of adjustments the variation becomes less and less. everything is modified to match expectations.
Except the adjustments have REDUCED the warming trend which goes against the expectations you deniers claim the real scientists have! All of the warmest areas have disappeared after the adjustments.
Which one of the major datasets has the highest temps and trends? BEST. Climate trends are supposed to be 30 years long. If you chop up the series into bit size pieces and rearrange them into what you want to see, what happens to the climatic signal? It's gone and you have a smeared homogeneous mess.
 
well the previous cooling phase before the current one was 1940 to 1970. I believe that to be under 100 years.
Not a cooling phase at all. A flat phase, yes, but not a cooling phase. A warming phase started in 1910 and flattened out by 1940. The "cooling" you claim never got near the 1910 low and by 1980 was at about the same place where the warming flattened out in 1940. We are flat again now with no cooling in sight, especially to the 1910 levels. In fact this flat cycle is even flatter then the previous flat cycle.

201301-201312.png
What I see is the cyclical trend that correlates to the 160 year solar cycle, Of which we only have about 80% of. Our recent hiatus of warming can be attributed to the top of the cycle as well as the average warmth of our records to date. What we are about to enter is the cooling phase which should last about 60-100 years. You alarmists are in for a really big let down emotionally and physically as the earth cools.
That is the same argument you deniers made in the 1970s with your last Ice Age prediction. How did that work out for you?

As the stop in global warming continues your dire predictions fail over and over again... What are you going to do in 5 years when the cooling trend is solidified and your lie can not be hidden further?
Doesn't it have to start cooling first before you can have a cooling trend? Don't count your chickens before they are hatched.
polar_bear_facepalm.jpg


14 years is not a trend?

trend
 
Not a cooling phase at all. A flat phase, yes, but not a cooling phase. A warming phase started in 1910 and flattened out by 1940. The "cooling" you claim never got near the 1910 low and by 1980 was at about the same place where the warming flattened out in 1940. We are flat again now with no cooling in sight, especially to the 1910 levels. In fact this flat cycle is even flatter then the previous flat cycle.

201301-201312.png
What I see is the cyclical trend that correlates to the 160 year solar cycle, Of which we only have about 80% of. Our recent hiatus of warming can be attributed to the top of the cycle as well as the average warmth of our records to date. What we are about to enter is the cooling phase which should last about 60-100 years. You alarmists are in for a really big let down emotionally and physically as the earth cools.
That is the same argument you deniers made in the 1970s with your last Ice Age prediction. How did that work out for you?

As the stop in global warming continues your dire predictions fail over and over again... What are you going to do in 5 years when the cooling trend is solidified and your lie can not be hidden further?
Doesn't it have to start cooling first before you can have a cooling trend? Don't count your chickens before they are hatched.

14 years is not a trend?

trend
Geezzz, deniers can't even count. Do you actually see 14 years in that graph?

Escalator1024.gif
 

Forum List

Back
Top