2021 State of The Climate Report: Empirical Observations Show No Sign of ‘Climate Crisis’ – ‘Snow Cover Stable, Sea Ice Levels Recovering, & No Change

The last Eight Years MIGHT be considered weather IF it wasn't just a CONTINUATION of a Centurial Climate change/warming.
Except it isn't a continuation at all, there are stretches of warming and other stretches of not warming and taking just the last 8 years as any kind of trend over a process that spans many millenia is ridiculous. There is no evidence that severe weather is the result of GW/CC and there is also no evidence that any period of GW/CC is due primarily to anthropogenic causes, it's all guesswork and estimates, projections and statistics that have been adjusted to show a desired result rather than the actual truth. How many times over the past 40 years or so have we seen declarations of impending disaster and the doom of mankind due to GW/CC that should have already occurred? NONE of which came true and still haven't.
 
The last Eight Years MIGHT be considered weather IF it wasn't just a CONTINUATION of a Centurial Climate change/warming.
But please use your observation to Hammer Morons like Flacaltenn and SunsetTommy who say it's "Been cooling since 2016" as idiotic rebuttal to the definitive Climate warming trend!! (aka "Going down the up escalator")

`
LOL so typical dead on arrival fallacy filled bullshit shows up because it has a red eyed drooling warmist yellowbelly GOOK behind it.

As usual your Swiss cheese brain forgets that I have repeatedly acknowledged warming trend since the 1690's, since 1850's since the late 1970's.

The COOLING trend since 2016 is true and factual which is why you are so upset since you can't refute it, which is why you never try, never claimed it eliminated the underlying long-term warming trend.

Meanwhile,

Post One article remains Unchallenged.
 
Obtuse much?
Dishonest Daily?
Again:
"""The last Eight Years MIGHT be considered weather IF it wasn't just a CONTINUATION of a Centurial Climate change/warming.""

WTF! are you that stupid or desperate to Twist the my post?
Unbelievably sick.
`

Post One article remains Unchallenged.
 
Obtuse much?
Dishonest Daily?
Again:
"""The last Eight Years MIGHT be considered weather IF it wasn't just a CONTINUATION of a Centurial Climate change/warming.""

WTF! are you that stupid or desperate to Twist the my post?
Unbelievably sick.
`

Hypocrite ... blind too ... why do temperatures go down between 1940 and 1980? ... you can't answer? ...
 
Hypocrite ... blind too ... why do temperatures go down between 1940 and 1980? ... you can't answer? ...
if you have no answer and Conceded my point, be glad to answer.
ergo:
First your many time Premise error.
It went "down" for only HALF that period then bottomed and started to go back Up again, only recovering and Surpassing new high by 1980. Ooops!
Who's "blind"?

More:
".... So what caused the cooling period that interrupted the overall trend in the middle of the century? The answer seems to lie in solar dimming, a cooling phenomenon caused by airborne pollutants.

The main culprit is likely to have been an increase in sulphate aerosols, which reflect incoming solar energy back into space and lead to cooling. This increase was the result of two sets of events.
  1. Industrial activities picked up following the Second World War. This, in the absence of pollution control measures, led to a rise in aerosols in the lower atmosphere (the troposphere).
  2. A number of volcanic eruptions released large amounts of aerosols in the upper atmosphere (the stratosphere).
Combined, these events led to aerosols overwhelming the warming trend at a time when solar activity showed little variation, leading to the observed cooling. Furthermore, it is possible to draw similar conclusions by looking at the daily temperature cycle. Because sunlight affects the maximum day-time temperature, aerosols should have a noticeable cooling impact on it. Minimum night-time temperatures, on the other hand, are more affected by greenhouse gases and therefore should not be affected by aerosols. Were these differences observed? The answer is yes: maximum day-time temperatures fell during this period but minimum night-time temperatures carried on rising.
The introduction of pollution control measures reduced the emission of sulphate aerosols. Gradually the cumulative effect of increasing greenhouse gases started to dominate in the 1970s and warming resumed.

As a final point, it should be noted that in 1945, the way in which sea temperatures were measured changed, leading to a substantial drop in apparent temperatures. Once the data are corrected, it is expected that the cooling trend in the middle of the century will be less pronounced."..."


Thank you for you ON TOPIC post even if it had a premise error, and you never challenge deluded morons like Sunsettommy and Flacalteen on their "Cooling since 2016" (and other recent years) Idiocy. Which you must understand is Bogus.
`
 
Last edited:
if you have no answer and Conceded my point, be glad to answer.
ergo:
First your many time Premise error.
It went "down" for only HALF that period then bottomed and started to go back Up again, only recovering and Surpassing new high by 1980. Ooops!
Who's "blind"?

More:
".... So what caused the cooling period that interrupted the overall trend in the middle of the century? The answer seems to lie in solar dimming, a cooling phenomenon caused by airborne pollutants.

The main culprit is likely to have been an increase in sulphate aerosols, which reflect incoming solar energy back into space and lead to cooling. This increase was the result of two sets of events.
  1. Industrial activities picked up following the Second World War. This, in the absence of pollution control measures, led to a rise in aerosols in the lower atmosphere (the troposphere).
  2. A number of volcanic eruptions released large amounts of aerosols in the upper atmosphere (the stratosphere).
Combined, these events led to aerosols overwhelming the warming trend at a time when solar activity showed little variation, leading to the observed cooling. Furthermore, it is possible to draw similar conclusions by looking at the daily temperature cycle. Because sunlight affects the maximum day-time temperature, aerosols should have a noticeable cooling impact on it. Minimum night-time temperatures, on the other hand, are more affected by greenhouse gases and therefore should not be affected by aerosols. Were these differences observed? The answer is yes: maximum day-time temperatures fell during this period but minimum night-time temperatures carried on rising.
The introduction of pollution control measures reduced the emission of sulphate aerosols. Gradually the cumulative effect of increasing greenhouse gases started to dominate in the 1970s and warming resumed.

As a final point, it should be noted that in 1945, the way in which sea temperatures were measured changed, leading to a substantial drop in apparent temperatures. Once the data are corrected, it is expected that the cooling trend in the middle of the century will be less pronounced."..."


Thank you for you ON TOPIC post even if it had a premise error, and you never challenge deluded morons like Sunsettommy and Flacalteen on their "Cooling since 2016" (and other recent years) Idiocy. Which you must understand is Bogus.
`

The COOLING trend since 2016 is true and factual which is why you are so upset since you can't refute it, which is why you never try, never claimed it eliminated the underlying long-term warming trend.

1650568766064.png


LINK

This is why you NEVER try to refute it.

Meanwhile,

Post One article remains Unchallenged.
 
The COOLING trend since 2016 is true and factual which is why you are so upset since you can't refute it, which is why you never try, never claimed it eliminated the underlying long-term warming trend.

View attachment 634091

LINK

This is why you NEVER try to refute it.

Meanwhile,

Post One article remains Unchallenged.
Um, 2020 was the SECOND HOTTEST Year, near tied with 2016.
(I made a thread start on it, probably still on pg 1)

So did it 'cool', then heat up again?
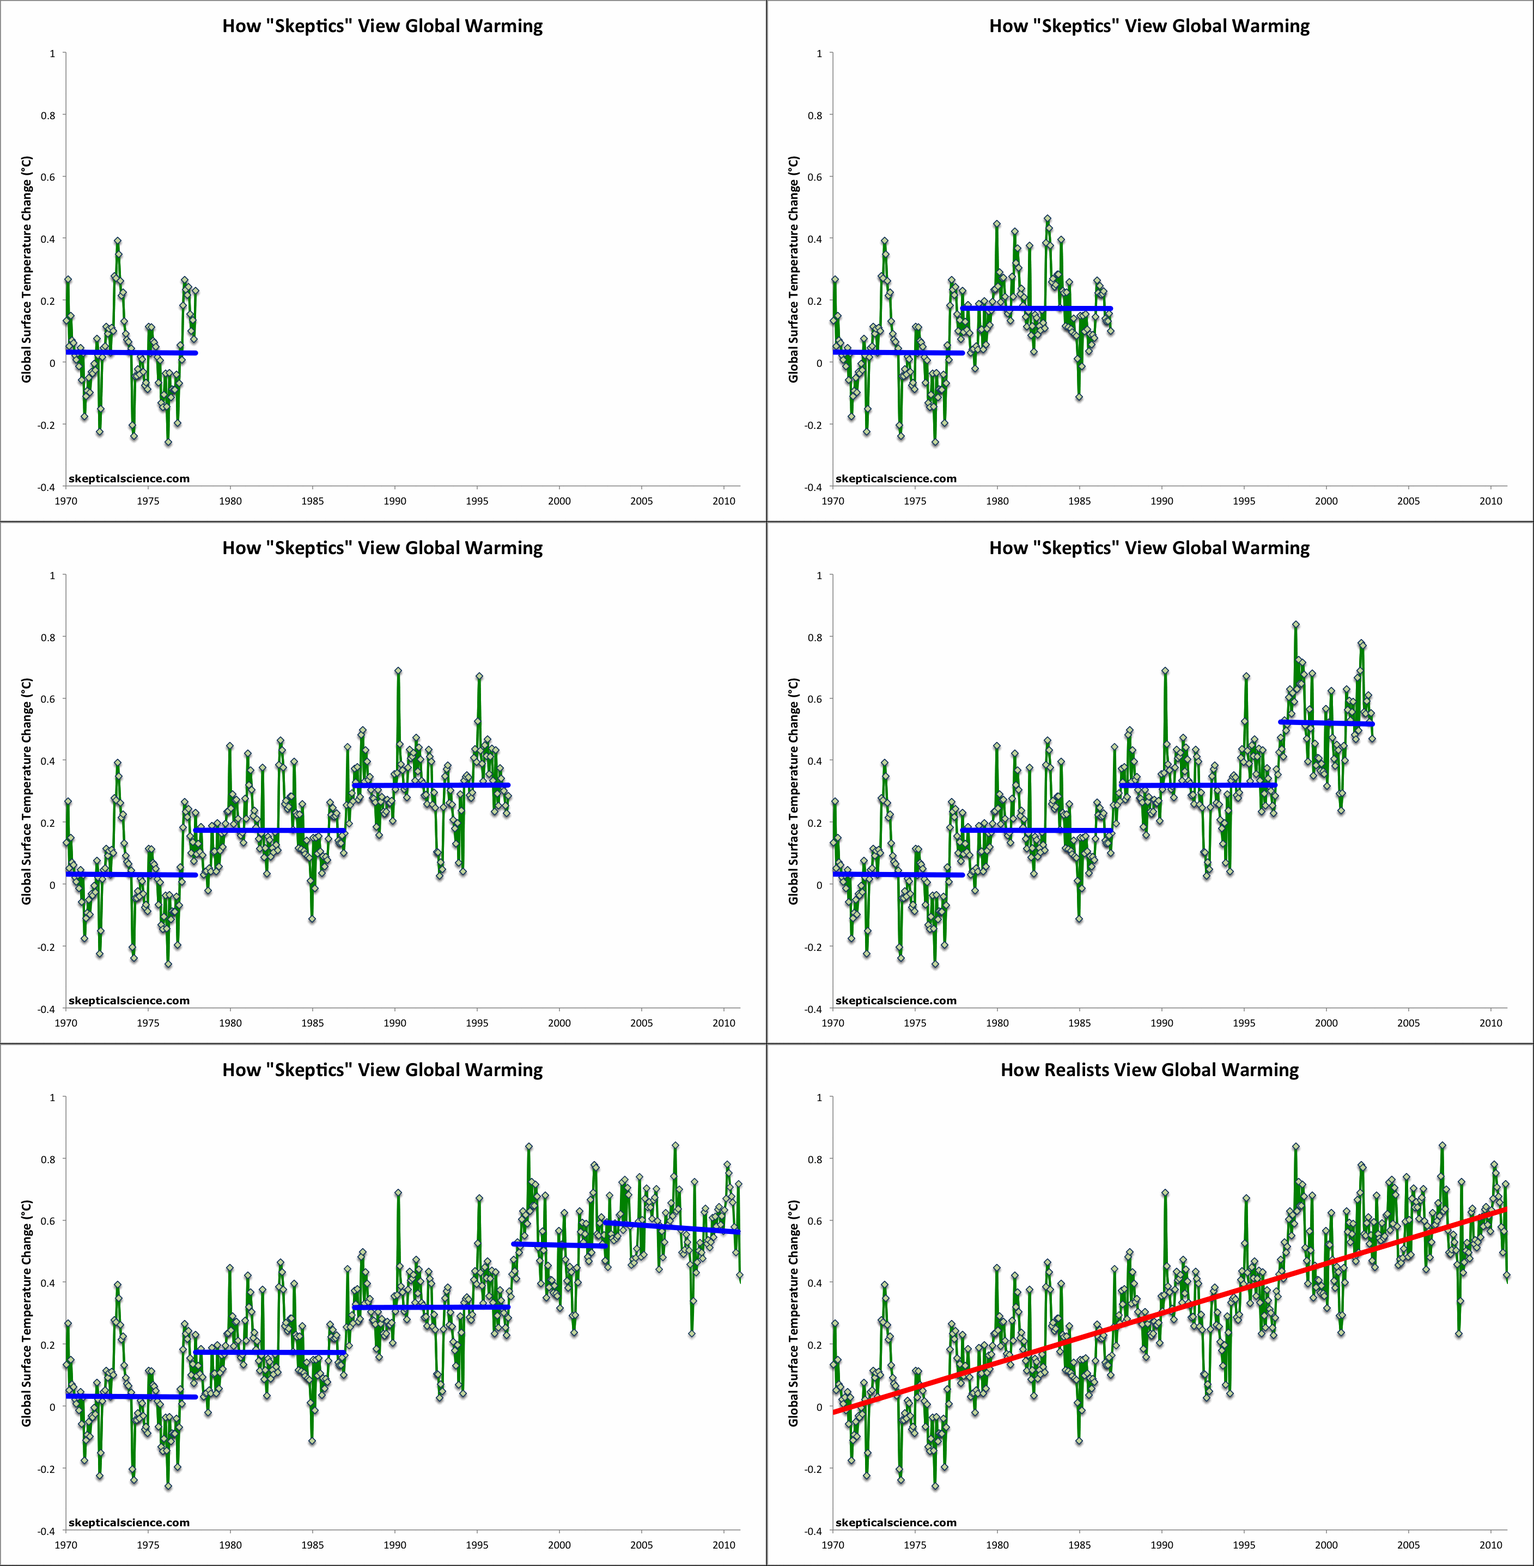
Or are you an IDIOT who can't pick the overall trend and keep trying to "Go up down the up escalator."
YOUR chart above is a classic!
Drawing down lines in an uptrend!

NCDC_Escalator.gif

Yeah Look! It keeps "Cooling."


you're a ****** NUT!
A Deluded RW Conspiracist. NO different than a 9/11 Troofer.
None at all.

`
`
 
Last edited:
Um, 2020 was the SECOND HOTTEST Year, near tied with 2016.
(I made a thread start on it, probably still on pg 1)

So did it 'cool', then heat up again?
Or are you an IDIOT who can't pick the overall trend and keep trying to "Go up down the up escalator."
YOUR chart above is a classic!
Drawing down lines in an uptrend!

NCDC_Escalator.gif

Yeah Look! It keeps "Cooling."


you're a ****** NUT!
A Deluded RW Conspiracist. NO different than a 9/11 Troofer.
None at all.

`
`

Which number is higher .70C in 2016 or .15C in March 2022?

Take your time you might finally get it....... but reality is too much for you to handle.....

What I posted was based on the published Temperature data which is why you are freaking out with stupid hottest year on record replies.

1650579207919.png


LINK

"WTI: The WoodForTrees Temperature Index​

When playing around with temperature graphs, I always found myself having to choose which of the four global temperature sources - HADCRUT4, GISTEMP, UAH, RSS - to use. Since they all have their differences, particularly around short-term responses to extreme events like the 1998 El Nino, I thought it would be nice to have an average of all four...

Hence I've created the WoodForTrees Temperature Index (WTI). This is created from the mean of HADCRUT4GL, GISTEMP, RSS and UAH, offset by their baseline differences. It covers only the time period where all four series are valid, so begins in 1979 and will only contain the latest month's values when all four sources are in. It is updated from the master sources at 3am GMT/BST each night."

red bolding mine
=====
Used four official databases for the creation of the chart.

You have been smashed but you will never understand why because you lack the intelligence to figure it out.
 
Which number is higher .70C in 2016 or .15C in March 2022?

Take your time you might finally get it....... but reality is too much for you to handle.....

What I posted was based on the published Temperature data which is why you are freaking out with stupid hottest year on record replies.

View attachment 634173

LINK

"WTI: The WoodForTrees Temperature Index​

When playing around with temperature graphs, I always found myself having to choose which of the four global temperature sources - HADCRUT4, GISTEMP, UAH, RSS - to use. Since they all have their differences, particularly around short-term responses to extreme events like the 1998 El Nino, I thought it would be nice to have an average of all four...

Hence I've created the WoodForTrees Temperature Index (WTI). This is created from the mean of HADCRUT4GL, GISTEMP, RSS and UAH, offset by their baseline differences. It covers only the time period where all four series are valid, so begins in 1979 and will only contain the latest month's values when all four sources are in. It is updated from the master sources at 3am GMT/BST each night."

red bolding mine
=====
Used four official databases for the creation of the chart.

You have been smashed but you will never understand why because you lack the intelligence to figure it out.
You are a MENTALLY ILL CONSPIRACIST. (because you can't be that Stupid)
Do you understand THIS is what you are doing you 12 IQ FREAKED Out Conspiracist.
Its full of 5-10 year flat or down sections while it's still getting WARMER/going up.

2016 AND 2022 much warmer than anything in the 1970-2010 graph.
The last EIGHT years the warmest in Recorded history if Not in perfect order.


NCDC_Escalator.gif


No graph of any natural phenomenon is Straight up or down/Every year.
You're a NUT.
A Conspiracist Freak who needs treatment/debriefing.
(TOWER 2 collapsed too fast!!! Demolition!!!)

`
 
Last edited:
You are a MENTALLY ILL CONSPIRACIST. (because you can't be that Stupid)
Do you understand THIS is what you are doing you 12 IQ FREAKED Out Conspiracist.
Its full of 5-10 year flat or down sections while it's still getting WARMER/going up.

2016 AND 2022 much warmer than anything in the 1970-2010 graph.
The last EIGHT years the warmest in Recorded history if Not in perfect order.


NCDC_Escalator.gif


No graph of any natural phenomenon is Straight up or down/Every year.
You're a NUT.
A Conspiracist Freak who needs treatment/debriefing.
(TOWER 2 collapsed too fast!!! Demolition!!!)

`

:muahaha:

Now we know Abu Afak doesn't agree with RSS and GISS temperature datasets used to make the chart.

Ha ha ha, you didn't refute anything I posted and again.... drumroll....,

Post One article remains Unchallenged.
 
It has been 5 days since I started this post only to see that warmist/alarmists can't address the content of this presentation:

2021 State of The Climate Report: Empirical Observations Show No Sign of ‘Climate Crisis’ – ‘Snow Cover Stable, Sea Ice Levels Recovering, & No Change in Storm Activity’​


:muahaha:

It appears they can't address it at all.
 
Watts Up With That?

2021 State of The Climate Report: Empirical Observations Show No Sign of ‘Climate Crisis’ – ‘Snow Cover Stable, Sea Ice Levels Recovering, & No Change in Storm Activity’​


Reposted from Climate Depot

In his annual State of the Climate report, Ole Humlum, emeritus professor at the University of Oslo, examined detailed patterns in temperature changes in the atmosphere and oceans together with trends in climate impacts. Many of these show no significant trends and suggest that poorly understood natural cycles are involved.

And while the report finds gentle warming, there is no evidence of dramatic changes, with snow cover stable, sea ice levels recovering, and no change in storm activity.


By: AdminClimate Depot

April 18, 2022 8:35 AM

LINK

===

Just like there is NO Climate Emergency

Just like there is NO Tropospheric "hot" spot

Just like there is NO dangerous trends

Just like there is NO massive refugee exodus

Watts up with That? Wow! A DENIALIST blog posting something from a well known denialist (Ole Humlum) that indicates that denialism is the way to go. Hmmmm....that's VERY INTERESTING and a COMPLETE SURPRISE!

Next thing you know snake oil salesmen will try to sell people snake oil!
 
The real key here is that this is the work of ONE SINGLE INDIVIDUAL (Ole Humlum) and his "spin" on others research.

It might be very interesting to discuss individual aspects of this, but it is HIGHLY unlikely that Sunsettommy himself has read it. It's just a nice headline from a denialist blog that he can hang his hat on.

I'd suggest that maybe Sunsettommy pick ONE FACTOID from this article, discuss why he is impressed by it and we can actually start a dialogue about that particular thing.

Instead of just flailing at the whole thing in one go.

But we all know that won't happen because Sunsettommy didn't read this, doesn't understand it, and has no clue how the REAL science works. So it would be a massive waste of time.

But it would be cool, wouldn't it?
 
Relax, chicken littles, we are in an interglacial cycle. Everything is normal. The sky is not falling.
 
Relax, chicken littles, we are in an interglacial cycle. Everything is normal. The sky is not falling.

The only reason people like you (non-scientists) know anything about interglacials is from the same work that tells us that the current warming is NOT driven predominantly by natural cycles.
 
The only reason people like you (non-scientists) know anything about interglacials is from the same work that tells us that the current warming is NOT driven predominantly by natural cycles.
Interesting. My introduction to the science began with an investigation for how hydrocarbons got into the arctic circle. So no, my knowledge about the interglacials wasn't driven by AGW nonsense. And the current warming trend is being driven by natural causes the same as it always was.
 

Forum List

Back
Top