Holy crap.......had to scroll down for 7 1/2 minutes on the list of growing glaciers!
Follow along with the video below to see how to install our site as a web app on your home screen.

Note: This feature currently requires accessing the site using the built-in Safari browser.
And those growing glaciers are a tiny minority of total glaciers. Cherrypicking fallacy, one that only a total retard would fall for.
Low altitude glaciers are seeing more days above freezing, so they're melting more and retreating. Those are the majority of glaciers.
High altitude glaciers are colder. Temperatures there have risen from "way below freezing" to "Still way below freezing, but slightly warmer", so they're not melting more. They are receiving more snowfall, because warming causes rising absolute humidity levels, which leads to more snowfall. Hence, those glaciers are growing.
So, the glaciers are reacting just as climate science predicted. Yet another stunningly successful prediction. Ho hum.
As that was middle-school level science, so most deniers will be unable to grasp it. If they could think, they wouldn't be deniers.
Any other stupid deflections you want to try, cultists? Old Rocks was right, and you deniers doing a retard-dogpile on him doesn't change that.
 . Deniers don't care if they are not "grasping it".
There are people on this thread that have been flap yapping about a cooling trend for many years. Yet, by every measure, we are warming, and doing so rapidly. One of the best measures of whether we are warming or cooling is glaciers. They reflect long term trends.
You say nothing about Old Rocks misleading video of a small area of the Yukon,
but get angry over a long list GROWING GLACIERS in many nations in many areas of the world.
You are so shallow in this stuff because you are deep into the AGW

You say nothing about Old Rocks misleading video of a small area of the Yukon,
Why do you think it was misleading? The glaciers are retreating, there and over most of the world.
but get angry over a long list GROWING GLACIERS in many nations in many areas of the world.
I understand. You fell hard for that cherrypicking scam. It's typical for those who have been scammed to get very angry at the people who reveal the scam, because they can't accept that they allowed themselves to be scammed.
You are so shallow in this stuff because you are deep into the AGW
As one example of how you act, you're still claiming the IPCC predicted 0.30C/decade warming, after I directly debunked that lie.
Global Warming
Your nonsense claim was false, and you know it, but you still peddle it. Conclusion? You care nothing about the facts, hence you have no credibility.
Quoting the next 2 decade rate is never the issue. The issue for policy and public planning would always require a five or 10 decade accurate prediction. Because of the ever decreasing rate estimates coming out since the circus came to town.
So quoting the RATE for just 20 years is not representative at all of the URGENCY of the problem. It's always been the shape of curve going out BEYOND that point that mattered. And in AR4, the awful scary teaser is still there for policy experts and the public and morons to mangle and misinterpret...
But thanks for pointing out how the original 1980s HYSTERIA that scared OldyRocks and mostly leftist Democrats around the world shitless has been debunked.
There are people on this thread that have been flap yapping about a cooling trend for many years. Yet, by every measure, we are warming, and doing so rapidly. One of the best measures of whether we are warming or cooling is glaciers. They reflect long term trends.
That’s nothing. Glacier Bay glacier in Alaska receded 60 miles in 70 years.
IN THE 19Th CENTURY.
Here again from the 2007 IPCC:
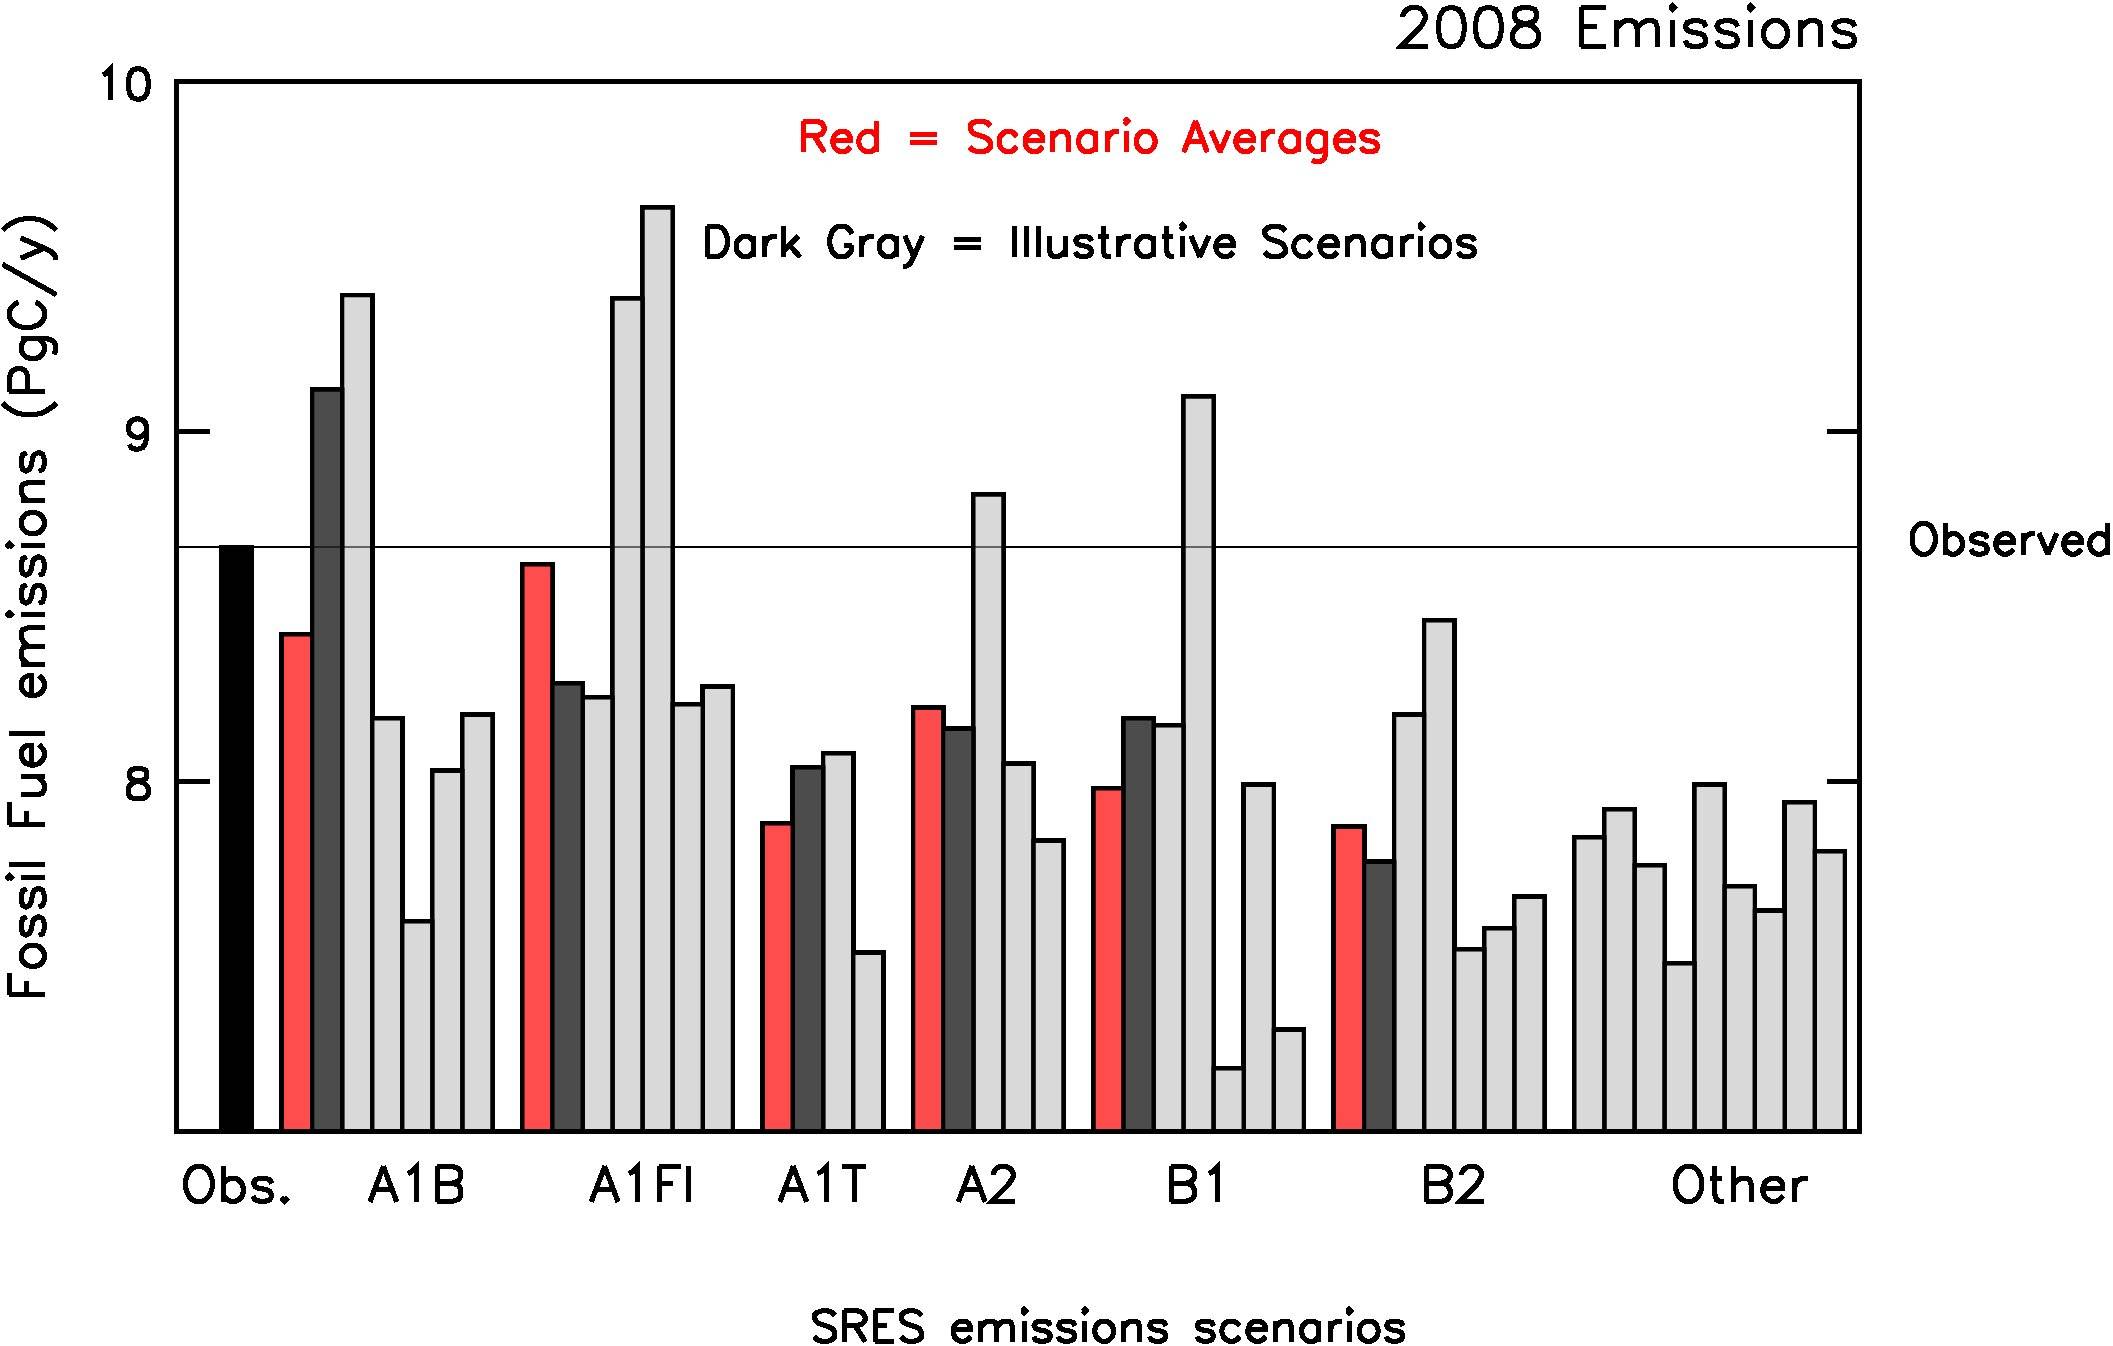
"For the next two decades, a warming of about 0.2°C per decade is projected for a range of SRES emission scenarios."
That was the MINIMUM warming rate based on their SRES emission scenarios,
while the .1C/decade you idiotically hang onto
despite that it isn't staying anywhere near the year 2000 emission rate at all,
OBVIOUSLY! which is why what I said that it was actually around the .30C/decade rate when you add the additional warming rate on top of the already stated .20C/decade rate based on the FIRST TWO decade SRES emission scenario.
The emission rate has been exceeding the SRES emission rate for a long while now.
Meanwhile you dishonestly overlook a nice list of GROWING Glaciers over many areas of the globe, which means you are trying hard to ignore contrary evidence.
There are people on this thread that have been flap yapping about a cooling trend for many years. Yet, by every measure, we are warming, and doing so rapidly. One of the best measures of whether we are warming or cooling is glaciers. They reflect long term trends.
There are people on this thread that have been flap yapping about a cooling trend for many years. Yet, by every measure, we are warming, and doing so rapidly. One of the best measures of whether we are warming or cooling is glaciers. They reflect long term trends.
Where can I send $ to save our glaciers?
Quoting the next 2 decade rate is never the issue. The issue for policy and public planning would always require a five or 10 decade accurate prediction. Because of the ever decreasing rate estimates coming out since the circus came to town.
We've been over this before. Sensitivity estimates haven't been decreasing. To speed things up, let's pretend you posted your chart of dishonest cherrypicks and junk science, and then I pointed out it was dishonest cherrypicks and junk science, and then I supplied the links to the real science.
So quoting the RATE for just 20 years is not representative at all of the URGENCY of the problem. It's always been the shape of curve going out BEYOND that point that mattered. And in AR4, the awful scary teaser is still there for policy experts and the public and morons to mangle and misinterpret...
So nobody is allowed to quote the rate now because it will change in the far future, based on emission rates? Wow. That makes no sense at all. The sensible thing is to state the current rate, and then state it can go up or down based on emissions. Which is what the science does.
But thanks for pointing out how the original 1980s HYSTERIA that scared OldyRocks and mostly leftist Democrats around the world shitless has been debunked.
And off you go on an insane political rant. As one of my ongoing points is how denialism is just one of many required insane beliefs of the right-wing-kook extremist cult, I thank you again for proving that point.
There are people on this thread that have been flap yapping about a cooling trend for many years. Yet, by every measure, we are warming, and doing so rapidly. One of the best measures of whether we are warming or cooling is glaciers. They reflect long term trends.
Where can I send $ to save our glaciers?

There are MANY published science papers that specifically show LOW CO2 sensitivity, try calling these "cherry picking"
Many more in the LINK
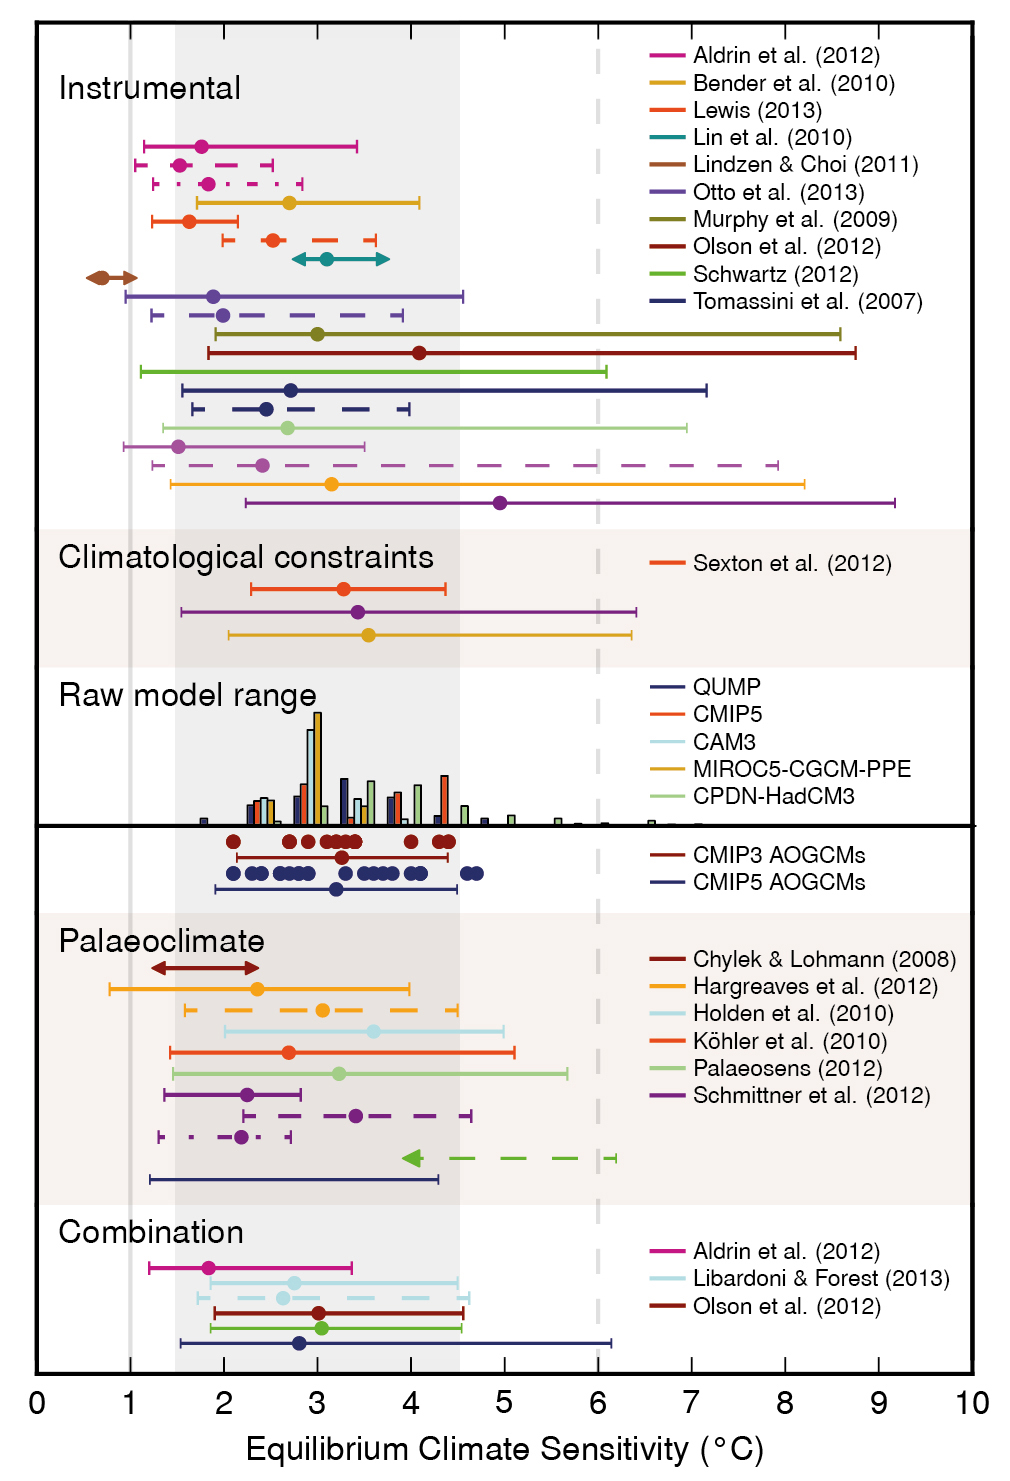
We've been over this before. Sensitivity estimates haven't been decreasing.
There are MANY published science papers that specifically show LOW CO2 sensitivity, try calling these "cherry picking"
I don't need to do that. I just need to point out they're laughably wrong, since the observed sensitivity is >2.0C minimum.
But hey, let's look at some of your list.
Smirnov, 2017 (2X CO2 = 0.4°C )
Not a scientific paper.
Florides and Christodoulides, 2009 (2X CO2 = ~0.02°C)
Not a scientific paper.
Newell and Dopplick, 1979 (2X CO2 = ~.0.25°C )
1979?
Gates et al., 1981 (2X CO2 = 0.3°C)
1981? Come on. The crazy claim here was that sensitivity estimates have been decreasing. You're showing that they're increasing.
Gray, 2009 (2X CO2 = ~0.4°C)
Not a scientific paper.
Holmes, 2018 (2XCO2 = -0.03°C)
Not a scientific paper.
Soon, Connolly, and Connolly, 2015 [full] (2X [400 ppm] CO2 = 0.44°C)
Well-paid fossil fuel shill WIlie Soon.
Many more in the LINK
And I'm sure they're all equally craptastic.Thanks for proving my point. We have real science, you have junk. Again, IPCC AR5, chapter 12. Hundreds of references there. Here's the summary..
