What Do Mitt Romney And Muhammed Ali Have In Common?

Depression+Unemployment.jpg

Am I doing this right ??.

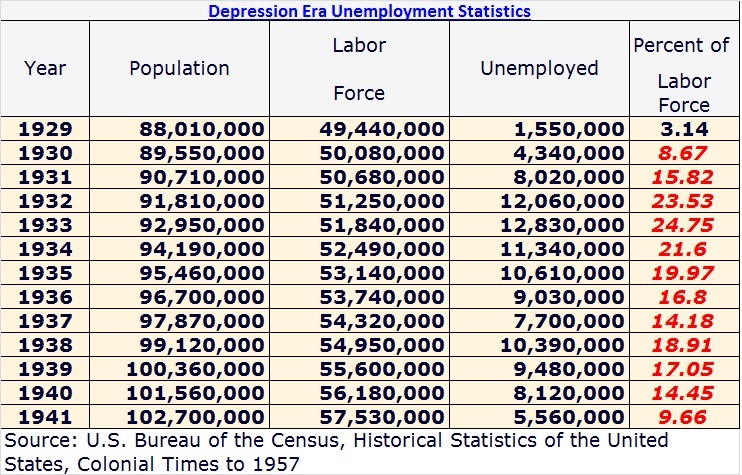
In 1929 you had (((88,010,0000))) people at the time (as far as total population goes), and this in America right, and then we see that there was a labor force employed of (((49,440,000))), and this of those total citizens right ? Then this ='s 55% working within the population during this 1929 date, in which equals to a 1.7 unemployment rate in and amongst this population back then right ?? Ok now lets see what the rest of these numbers are saying, and this as it relates to the citizens being dependent or not dependent on the government back then, as opposed to what is being found within this nation now and during these tough time periods in which we are having right now in America, and whether or not we are as dependents or we are not dependent as of the large majority of us in this nation should not be dependent today, because that is the most important thing of all to be looked for in these differing numbers throughout time (imho).

1930 - 89,550,000 to 50,080,000 = 56% working = 4.8 unemployment rate.
1931 - 90,710,000 to 50,680,000 = 56% " " " " " = 8.8 unemployment rate.
1932 - 91,810,000 to 51,250,000 = 56% " " " " " = 1.3 unemployment rate.
1933 - 92,950,000 to 51,840,000 = 56% " " " " " = 1.4 unemployment rate.
1934 - 94,190,000 to 52,490,000 = 56% " " " " " = 1.2 unemployment rate.
1935 - 95,460,000 to 53,140,000 = 55% " " " " " = 1.1 unemployment rate.
1936 - 96,700,000 to 53,740,000 = 55% " " " " " = 0.9 unemployment rate.
1937 - 97,870,000 to 54,320,000 = 55% " " " " " = 0.7 unemployment rate.
1938 - 99,120,000 to 54,950,000 = 55% " " " " " = 1.0 unemployment rate.
1939 - 100,360,000 to 55,600,000 = 55% " " " " = 0.9 unemployment rate.
1940 - 101,560,000 to 56,180,000 = 55% " " " " = 0.7 unemployment rate.
1941 - 102,700,000 to 57,530,000 = 56% " " " " = 0.5 unemployment rate.


Now the goal would be to get as many employed as possible, and to get them depending way less on the government when setting out to achieve such a goal. Now how has Obama and the ones before him been doing on these numbers in todays world and/or time periods in which we are dealing with directly now ? How much dependency is out there right now ya reckon ?
 
Last edited:
Clinton obviously didn't understand that with his political ambition of being president of the U.S. you couldn't pick your wars and if you wanted to become the Commander-in-Chief of the the U.S. Military being a chickenshit draft dodger didn't look real good on your resume.

Unfortunately with so many brain dead, chickenshit, morons voting for democrats, it doesn't really matter if a democratic candidate is a dope smoking, coke sniffing, draft dodging poc.
 
Bush removed the threatening regimes of Saddam and the Taliban from power. Bush launched the surge strategy that finally brought relative stability to Iraq. Obama opposed the Surge but later admitted, "it was a good thing". Then Obama adopted the Bush surge strategy in Iraq for Afghanistan.

As for the economy, I think you need to let these average unemployment rates for Presidents since World War II sink in.

Average Unemployment Rates For US Presidents Since World War II:

01. Lyndon Johnson: 4.19%
02. Harry Truman: 4.26%
03. Dwight Eisenhower: 4.89%
04. Richard Nixon: 5.00%
05. Bill Clinton: 5.20%
06. George W. Bush: 5.27%
07. John Kennedy: 5.98%
08. George H.W. Bush: 6.30%
09. Jimmy Carter: 6.54%
10. Ronald Reagan: 7.54%
11. Gerald Ford: 7.77%
12. Barack Obama: 9.06%

I notice that you conveniently used averages and that takes into account what an administration assumed when they took office. Obama has looked bad because of the miserable mess he assumed. In other words when FDR took over Hoover's 24% unemployment I'm sure he didn't want that averaged in with his WPA, RFD, CCC, TVA etc. hiring:

Depression+Unemployment.jpg


Each Republican run all the way back to Hoover left a higher unemployment rate than what they assumed. It's a documented matter of record. Don't let the Reagan numbers fool you because G.H.W. Bush came along behind him and his four years ended in recession

Hoover's mess took eight years and a world war to straighten out. He and the banks made the mess and there's little difference in then and George Bush and the banks in 2008. The big difference is Bush gave the banks $800 billion and Hoover couldn't.

Averages take into account EVERYTHING, the good, the bad, and the ugly. 100% objective. There is no cherry picking involved!

What is used is the monthly unemployment rates from the beuro of labor statistics. In an eight year administration, a lot can happen. Figures will rise, go down, and rise again. If you only used the first month and the last month of an administration your not at all getting a true picture of what life was like while that particular President was in office. If you only use month #1 and month #96, you ignore 94 months of information and conditions that the public experienced while that President was in office.

In order to be accurate and objective, one must consider ALL THE DATA! Cherry picking pieces of data only leads to an inacurate image of what the average person experienced during the time the particular President was in the White House. To say that the only months during the Bush administration that mattered were January 2001 and December 2008 is crazy. Years like 2005, 2006, etc. are just as important in assessing the administration in power as well as estimating what the average person experienced during that persons time in office.


In any event you made to factual mistakes in your post. Reagan left office with 5.3% unemployment which is less than the 7.5% that he came in with, but again, to accurately look at Reagans time in office you need to look at ALL 96 months, not just 2 months.

George Bush Sr.'s time in office DID NOT END IN RECESSION! Here are the real quartally GDP growth rates from Bush Sr.'s time in office:


1989 01 3·8060
1989 02 3.0287
1989 03 3.2091
1989 04 0·8765
1990 01 4.2433
1990 02 1·6004
1990 03 -0.0050
1990 04 -3·4611
1991 01 -1.9204
1991 02 2.7265
1991 03 1·6963
1991 04 1.5782
1992 01 4·4637
1992 02 4.3182
1992 03 4·1919
1992 04 4·2724

Each of the last 4 quarters of George Bush Sr.'s President had the economy growing at a robust 4% growth rate. No other President since George Bush Sr. has had four consecutive quarters of real GDP growth above 4%. The Recession during Bush Sr.'s time in office ended in the Spring of 1991, a year and a half before he faced re-election.

You can find quartely real GDP growth rates from 1947 to 2012 here for the United States:

Quarterly Growth in real GDP at annual rates, Percent

As for comparing Hoover with W, or FDR, there is no comparison. The slide in economic activity at the very end of the Bush administration is nothing compared to what happened during the great depression.

At the end of the day, the fact remains that Obama's time in office has seen the highest average unemployment rates of any President since World War II. I went back to World War II because the labor department only has unemployment rates for EACH month since 1947. Annual estimates before 1947 are available though.

If you included all the Presidents since George Washington, Obama would still rank near the bottom, with only Hoover and FDR having worse average rates.


Average Unemployment Rates For US Presidents Since World War II:

01. Lyndon Johnson: 4.19%
02. Harry Truman: 4.26%
03. Dwight Eisenhower: 4.89%
04. Richard Nixon: 5.00%
05. Bill Clinton: 5.20%
06. George W. Bush: 5.27%
07. John Kennedy: 5.98%
08. George H.W. Bush: 6.30%
09. Jimmy Carter: 6.54%
10. Ronald Reagan: 7.54%
11. Gerald Ford: 7.77%
12. Barack Obama: 9.06%

Bullshit!

"It's The Economy Stupid" won the election for Clinton. That and H. Ross Perot getting over 15% of the vote. At the end of the Reagan/Bush41 terms the unemployment rate was four tenths of a percent higher than when Jimmy Carter left office.
 
Last edited:
I notice that you conveniently used averages and that takes into account what an administration assumed when they took office. Obama has looked bad because of the miserable mess he assumed. In other words when FDR took over Hoover's 24% unemployment I'm sure he didn't want that averaged in with his WPA, RFD, CCC, TVA etc. hiring:

Depression+Unemployment.jpg


Each Republican run all the way back to Hoover left a higher unemployment rate than what they assumed. It's a documented matter of record. Don't let the Reagan numbers fool you because G.H.W. Bush came along behind him and his four years ended in recession

Hoover's mess took eight years and a world war to straighten out. He and the banks made the mess and there's little difference in then and George Bush and the banks in 2008. The big difference is Bush gave the banks $800 billion and Hoover couldn't.

Averages take into account EVERYTHING, the good, the bad, and the ugly. 100% objective. There is no cherry picking involved!

What is used is the monthly unemployment rates from the beuro of labor statistics. In an eight year administration, a lot can happen. Figures will rise, go down, and rise again. If you only used the first month and the last month of an administration your not at all getting a true picture of what life was like while that particular President was in office. If you only use month #1 and month #96, you ignore 94 months of information and conditions that the public experienced while that President was in office.

In order to be accurate and objective, one must consider ALL THE DATA! Cherry picking pieces of data only leads to an inacurate image of what the average person experienced during the time the particular President was in the White House. To say that the only months during the Bush administration that mattered were January 2001 and December 2008 is crazy. Years like 2005, 2006, etc. are just as important in assessing the administration in power as well as estimating what the average person experienced during that persons time in office.


In any event you made to factual mistakes in your post. Reagan left office with 5.3% unemployment which is less than the 7.5% that he came in with, but again, to accurately look at Reagans time in office you need to look at ALL 96 months, not just 2 months.

George Bush Sr.'s time in office DID NOT END IN RECESSION! Here are the real quartally GDP growth rates from Bush Sr.'s time in office:


1989 01 3·8060
1989 02 3.0287
1989 03 3.2091
1989 04 0·8765
1990 01 4.2433
1990 02 1·6004
1990 03 -0.0050
1990 04 -3·4611
1991 01 -1.9204
1991 02 2.7265
1991 03 1·6963
1991 04 1.5782
1992 01 4·4637
1992 02 4.3182
1992 03 4·1919
1992 04 4·2724

Each of the last 4 quarters of George Bush Sr.'s President had the economy growing at a robust 4% growth rate. No other President since George Bush Sr. has had four consecutive quarters of real GDP growth above 4%. The Recession during Bush Sr.'s time in office ended in the Spring of 1991, a year and a half before he faced re-election.

You can find quartely real GDP growth rates from 1947 to 2012 here for the United States:

Quarterly Growth in real GDP at annual rates, Percent

As for comparing Hoover with W, or FDR, there is no comparison. The slide in economic activity at the very end of the Bush administration is nothing compared to what happened during the great depression.

At the end of the day, the fact remains that Obama's time in office has seen the highest average unemployment rates of any President since World War II. I went back to World War II because the labor department only has unemployment rates for EACH month since 1947. Annual estimates before 1947 are available though.

If you included all the Presidents since George Washington, Obama would still rank near the bottom, with only Hoover and FDR having worse average rates.


Average Unemployment Rates For US Presidents Since World War II:

01. Lyndon Johnson: 4.19%
02. Harry Truman: 4.26%
03. Dwight Eisenhower: 4.89%
04. Richard Nixon: 5.00%
05. Bill Clinton: 5.20%
06. George W. Bush: 5.27%
07. John Kennedy: 5.98%
08. George H.W. Bush: 6.30%
09. Jimmy Carter: 6.54%
10. Ronald Reagan: 7.54%
11. Gerald Ford: 7.77%
12. Barack Obama: 9.06%

Bullshit!

"It's The Economy Stupid" won the election for Clinton. That and H. Ross Perot getting over 15% of the vote. At the end of the Reagan/Bush41 terms the unemployment rate was four tenths of a percent higher than when Jimmy Carter left office.
Well then Mitt Romeny should become the next President of The USA then, because he is a better manager of economic situations and/or a proper budgeting manager as is found within various misc. economies/budgets in which are found within the over all, than Obama is, has been or ever will be, and that has been established and proven in records there of between the two.
 
Clinton obviously didn't understand that with his political ambition of being president of the U.S. you couldn't pick your wars and if you wanted to become the Commander-in-Chief of the the U.S. Military being a chickenshit draft dodger didn't look real good on your resume.

Um.... he won the presidency and served two terms. :eusa_hand:
 
Averages take into account EVERYTHING, the good, the bad, and the ugly. 100% objective. There is no cherry picking involved!

What is used is the monthly unemployment rates from the beuro of labor statistics. In an eight year administration, a lot can happen. Figures will rise, go down, and rise again. If you only used the first month and the last month of an administration your not at all getting a true picture of what life was like while that particular President was in office. If you only use month #1 and month #96, you ignore 94 months of information and conditions that the public experienced while that President was in office.

In order to be accurate and objective, one must consider ALL THE DATA! Cherry picking pieces of data only leads to an inacurate image of what the average person experienced during the time the particular President was in the White House. To say that the only months during the Bush administration that mattered were January 2001 and December 2008 is crazy. Years like 2005, 2006, etc. are just as important in assessing the administration in power as well as estimating what the average person experienced during that persons time in office.


In any event you made to factual mistakes in your post. Reagan left office with 5.3% unemployment which is less than the 7.5% that he came in with, but again, to accurately look at Reagans time in office you need to look at ALL 96 months, not just 2 months.

George Bush Sr.'s time in office DID NOT END IN RECESSION! Here are the real quartally GDP growth rates from Bush Sr.'s time in office:


1989 01 3·8060
1989 02 3.0287
1989 03 3.2091
1989 04 0·8765
1990 01 4.2433
1990 02 1·6004
1990 03 -0.0050
1990 04 -3·4611
1991 01 -1.9204
1991 02 2.7265
1991 03 1·6963
1991 04 1.5782
1992 01 4·4637
1992 02 4.3182
1992 03 4·1919
1992 04 4·2724

Each of the last 4 quarters of George Bush Sr.'s President had the economy growing at a robust 4% growth rate. No other President since George Bush Sr. has had four consecutive quarters of real GDP growth above 4%. The Recession during Bush Sr.'s time in office ended in the Spring of 1991, a year and a half before he faced re-election.

You can find quartely real GDP growth rates from 1947 to 2012 here for the United States:

Quarterly Growth in real GDP at annual rates, Percent

As for comparing Hoover with W, or FDR, there is no comparison. The slide in economic activity at the very end of the Bush administration is nothing compared to what happened during the great depression.

At the end of the day, the fact remains that Obama's time in office has seen the highest average unemployment rates of any President since World War II. I went back to World War II because the labor department only has unemployment rates for EACH month since 1947. Annual estimates before 1947 are available though.

If you included all the Presidents since George Washington, Obama would still rank near the bottom, with only Hoover and FDR having worse average rates.


Average Unemployment Rates For US Presidents Since World War II:

01. Lyndon Johnson: 4.19%
02. Harry Truman: 4.26%
03. Dwight Eisenhower: 4.89%
04. Richard Nixon: 5.00%
05. Bill Clinton: 5.20%
06. George W. Bush: 5.27%
07. John Kennedy: 5.98%
08. George H.W. Bush: 6.30%
09. Jimmy Carter: 6.54%
10. Ronald Reagan: 7.54%
11. Gerald Ford: 7.77%
12. Barack Obama: 9.06%

Bullshit!

"It's The Economy Stupid" won the election for Clinton. That and H. Ross Perot getting over 15% of the vote. At the end of the Reagan/Bush41 terms the unemployment rate was four tenths of a percent higher than when Jimmy Carter left office.
Well then Mitt Romeny should become the next President of The USA then, because he is a better manager of economic situations and/or a proper budgeting manager as is found within various misc. economies/budgets in which are found within the over all, than Obama is, has been or ever will be, and that has been established and proven in records there of between the two.

That's your opinion and that's all it is.............
No it's factual, and that's all there is to it.....
 
I notice that you conveniently used averages and that takes into account what an administration assumed when they took office. Obama has looked bad because of the miserable mess he assumed. In other words when FDR took over Hoover's 24% unemployment I'm sure he didn't want that averaged in with his WPA, RFD, CCC, TVA etc. hiring:

Depression+Unemployment.jpg


Each Republican run all the way back to Hoover left a higher unemployment rate than what they assumed. It's a documented matter of record. Don't let the Reagan numbers fool you because G.H.W. Bush came along behind him and his four years ended in recession

Hoover's mess took eight years and a world war to straighten out. He and the banks made the mess and there's little difference in then and George Bush and the banks in 2008. The big difference is Bush gave the banks $800 billion and Hoover couldn't.

Averages take into account EVERYTHING, the good, the bad, and the ugly. 100% objective. There is no cherry picking involved!

What is used is the monthly unemployment rates from the beuro of labor statistics. In an eight year administration, a lot can happen. Figures will rise, go down, and rise again. If you only used the first month and the last month of an administration your not at all getting a true picture of what life was like while that particular President was in office. If you only use month #1 and month #96, you ignore 94 months of information and conditions that the public experienced while that President was in office.

In order to be accurate and objective, one must consider ALL THE DATA! Cherry picking pieces of data only leads to an inacurate image of what the average person experienced during the time the particular President was in the White House. To say that the only months during the Bush administration that mattered were January 2001 and December 2008 is crazy. Years like 2005, 2006, etc. are just as important in assessing the administration in power as well as estimating what the average person experienced during that persons time in office.


In any event you made to factual mistakes in your post. Reagan left office with 5.3% unemployment which is less than the 7.5% that he came in with, but again, to accurately look at Reagans time in office you need to look at ALL 96 months, not just 2 months.

George Bush Sr.'s time in office DID NOT END IN RECESSION! Here are the real quartally GDP growth rates from Bush Sr.'s time in office:


1989 01 3·8060
1989 02 3.0287
1989 03 3.2091
1989 04 0·8765
1990 01 4.2433
1990 02 1·6004
1990 03 -0.0050
1990 04 -3·4611
1991 01 -1.9204
1991 02 2.7265
1991 03 1·6963
1991 04 1.5782
1992 01 4·4637
1992 02 4.3182
1992 03 4·1919
1992 04 4·2724

Each of the last 4 quarters of George Bush Sr.'s President had the economy growing at a robust 4% growth rate. No other President since George Bush Sr. has had four consecutive quarters of real GDP growth above 4%. The Recession during Bush Sr.'s time in office ended in the Spring of 1991, a year and a half before he faced re-election.

You can find quartely real GDP growth rates from 1947 to 2012 here for the United States:

Quarterly Growth in real GDP at annual rates, Percent

As for comparing Hoover with W, or FDR, there is no comparison. The slide in economic activity at the very end of the Bush administration is nothing compared to what happened during the great depression.

At the end of the day, the fact remains that Obama's time in office has seen the highest average unemployment rates of any President since World War II. I went back to World War II because the labor department only has unemployment rates for EACH month since 1947. Annual estimates before 1947 are available though.

If you included all the Presidents since George Washington, Obama would still rank near the bottom, with only Hoover and FDR having worse average rates.


Average Unemployment Rates For US Presidents Since World War II:

01. Lyndon Johnson: 4.19%
02. Harry Truman: 4.26%
03. Dwight Eisenhower: 4.89%
04. Richard Nixon: 5.00%
05. Bill Clinton: 5.20%
06. George W. Bush: 5.27%
07. John Kennedy: 5.98%
08. George H.W. Bush: 6.30%
09. Jimmy Carter: 6.54%
10. Ronald Reagan: 7.54%
11. Gerald Ford: 7.77%
12. Barack Obama: 9.06%

Bullshit!

"It's The Economy Stupid" won the election for Clinton. That and H. Ross Perot getting over 15% of the vote. At the end of the Reagan/Bush41 terms the unemployment rate was four tenths of a percent higher than when Jimmy Carter left office.

Sorry, but there is no "Bullshit" here, just the facts that I stated and sited. In terms of real GDP growth, George H.W. Bush had over 4% growth for each of the quarters during his last year in office. Fantastic economic growth. Unfortunately, because unemployment is considered to be a "lagging indicator", the unemployment rate continued to rise and peaked at 7.8% in July 1992. That doesn't change the fact that the economy was growing rapidly at that point. Most business's after a recession are conservative when it comes to hiring and only do so when it becomes and absolute necessity.

Jimmy Carter left office in January 1981. In January 1981, the unemployment rate was 7.5%. Bush Sr. left office in January 1993. In January 1993, the unemployment rate was 7.3%. So the unemployment rate was actually lower when Bush Sr. left office than it was when Carter left. Just as important though, the inflation rate was not nearly as high when Bush left office compared to Carter.

You can find all the monthly unemployment rates from January of 1948 up to today at the Bureau of Labor Statistics.

http://www.bls.gov/data/
 

Forum List

Back
Top