Watching the sea ice melt in the arctic 2012!

What is being said here is that at the end of the melt season, as the angle of the sun decreases, the increased temparture of the open water will not prevent the freezeup. Nowhere does it state that this effect will prevent melting when the angle of the sun is higher.

http://soa.arcus.org/sites/soa.arcu...tween-arctic-system-components/pdf/sedlar.pdf

Summary
The surface temperature time series illustrates a series of regimes, where the first few days are at the end of the summer melt season. This regime is followed by a temporary cold period, mainly caused by
advective processes; surface temperature is higher than near surface air temperature. Melt ponds and open water starts freezing and at the end a weather system with new snow passes. This permanently
increases the surface albedo and although cloud radiative forcing is large and positive in the following period, surface temperatures never recover, and as the cloud cover dissapate at the end, the temperatures plunge.

More proof of the ‘climate warming’ hoax: Polar Ice Caps Larger than Long-Term Average, NOAA Satellites Show at US Action News

More proof of the ‘climate warming’ hoax: Polar Ice Caps Larger than Long-Term Average, NOAA Satellites Show

The earth’s polar ice caps are no smaller today than they were 30 years ago, when satellites first began accurately measuring polar ice, NOAA satellite data report. The polar ice caps are currently somewhat larger than the 30-year average.

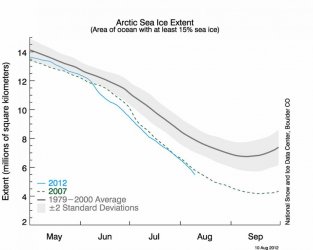
In the Northern Hemisphere, Arctic sea ice is currently 19 percent below the 30-year average. In the Southern Hemisphere, however, Antarctic sea ice has grown to a record extent, continuing a pattern of growth that has been ongoing since NASA launched the NOAA satellite instruments in 1979. The growth in Antarctic sea ice is so extensive that the poles as a whole have more total ice than the 30-year average.

Global warming alarmists and the mainstream media are nevertheless continuing their campaign of deception and deceit, raising alarm about Arctic sea ice as an alleged sign of alarming global warming, while completely ignoring the Antarctic ice cap.

The “science” journal Nature reports in a July 14 Nature.com article, “In a sadly familiar refrain, the Arctic has set another record for losing sea ice. Last month, the extent of sea ice in the Arctic hit the lowest mark for any June since satellite records started in 1979.” The article makes no mention of expanding Antarctic sea ice or the overall growth of polar ice.

Mongabay similarly reports, “In June the average sea ice extent in the Arctic was the lowest on record for that month, according to the National Snow and Ice Data Center (NSIDC). Measured by satellites, the seasonal movements of Arctic ice have been tracked since 1979 with a dramatic decline observed over the last 30 years. This decline is linked by experts to climate change.”

Global warming alarmists wonder why the public no longer believes their cries of alarm, and the mainstream media wonders why they are losing money, audience, and relevance. The answer is concisely illustrated in their claims about the polar ice caps. Global warming alarmists and the mainstream media can cherry-pick and misrepresent facts only so long before the public realizes they would have better luck getting the straight truth from a used car salesman.
 
Sea ice continues to track at low levels

July 24, 2012


Arctic sea ice continued to track at levels far below average through the middle of July, with open water in the Kara and Barents seas reaching as far north as typically seen during September. Melt onset began earlier than normal throughout most of the Arctic.

—
Figure 1. Arctic sea ice extent for July 23, 2012 was 7.32 million square kilometers (2.82 million square miles). The magenta line shows the 1979 to 2000 median extent for that month. The black cross indicates the geographic North Pole. Sea Ice Index data. About the data

Credit: National Snow and Ice Data Center
High-resolution image


Overview of conditions
As of July 23, 2012, sea ice extent was 7.32 million square kilometers (2.82 million square miles). On the same day last year, ice extent was 7.22 million square kilometers (2.78 million square miles), the previous record low for this day.

Arctic sea ice extent continued to track at very low levels, setting daily record lows for the satellite era for a few days in early July. Extent is especially low in the Barents, Kara, and Laptev seas. In the Barents and Kara seas, the area of open water extends to the north coasts of Franz Josef Land and Severnaya Zemlya, as far north as typically seen during September, the end of the summer melt season. Polynyas in the Beaufort and East Siberian seas continued to expand during the first half of July. By sharp contrast, ice extent in the Chukchi Sea remains near normal levels. In this region the ice has retreated back to the edge of the multiyear ice cover. Ice cover in the East Greenland Sea, while of generally low concentration, remains
Arctic Sea Ice News and Analysis | Sea ice data updated daily with one-day lag

What's saving it from blowing last year away is there is a huge arctic storm over the Pacific side. This is keeping it intact for now. Still below 2007 for this time...2011 starts moving inward within the next week or two...So if this can stay below 2007 we will start being at record levels soon.
 
Last edited:
As the global system incorporates more melt, the plots of sea ice will turn, clockwise, from year-to-year.

This will happen, as more water in the climate systems ends up, as annual ice, and more heat prevents this, from becoming perennial ice.

Local systems like Alaska will show more precip and slightly lower temps, while everybody else roasts or swims.
 
As the global system incorporates more melt, the plots of sea ice will turn, clockwise, from year-to-year.

This will happen, as more water in the climate systems ends up,[sic] as annual ice,[sic] and more heat prevents this,[sic] from becoming perennial ice.

Local systems like Alaska will show more precip and slightly lower temps, while everybody else roasts or swims.


Learn the language or get the fuck out of my country, moron.
 
What language is that, fused-sentence-faggot-rap?

Eat shit, in traffic, Punkotardy. Do it, today!
 
Bugnuts still has no fucking clue what he is trying to talk about, I see.
 
You're here, so I talk about you, RightWingFaggotThatRunsWordsTogether.

I'll go get a scientific report or study, before you do it. You haven't linked, once. You haven't loaded a graph. You are a PUNK, and you're TARDY. I know you didn't forget, hiow you are some faggot, since the 'fagot' holds the 'faces,' in place.
 
Here's the jpgs from NASA, 1980 and 2012:


626812main_MultiYr_seaIce_1980.jpg


626813main_MultiYr_seaIce_2012.jpg


This is from the NASA link, which O.R. or somebody earlier pasted.
 
8-9
index.php


Last year at this time
index.php


two years ago at this time
index.php


I'm a goddamn skeptic and I'll say that it's possible that the arctic will be mostly ice free at the min within 5-8 years at this rate. Look how the 3-5m ice has went away in the last 2 years.
 
Last edited:
O shit we're about 7-10 days ahead of 2007 at least. There's a fair chance we will have the record this year...Even with the huge cyclone over the arctic and the shitty pattern...


This isn't anywhere near 2007 in set up. The volume has caught up enough that even a shitty pattern will fall through the floor. Mostly 1-2 meter ice is what I'm saying.

By shitty pattern. I give you the ECMWF model from 3-6 days...See how much of the arctic is under that cyclone? That isn't a good melting pattern.
 

Attachments

  • $N_stddev_timeseries 8-11.jpg
    $N_stddev_timeseries 8-11.jpg
    48.9 KB · Views: 56
  • $ecmwf_500p_4panel.gif
    $ecmwf_500p_4panel.gif
    81.1 KB · Views: 61
Last edited:
icethickness080912.jpg


There’s a new kid in town, blog-wise, showing maps of Arctic sea ice concentration and thickness, called apocalypse4real (seems to be an appropriate name). It shows that all the ice thicker than 6m is gone from the Arctic (click the graph for a larger, clearer view):

Ice thicker than 6m would show in black (but there isn’t any), red is 6m thick, dark blue is open water.

Furthermore Neven’s caution that the storm in the Arctic might wreak havoc with its sea ice seems to be premonitory. Both extent (from NSIDC) and area (from Cryosphere Today) have taken a nosedive lately, setting new record lows for this date (click either graph for a larger, clearer view):

(Cryosp)here today, gone tomorrow | Open Mind


Sea Ice Concentration


Dark Red = 100%

Dark Blue = 0%

https://sites.google.com/site/apocalypse4real/home/sea-ice-concentration-and-thickness-comparison

8-11 right hand side; This shows the arctic on a scale of 1 meter or less of sea ice. Unlike the one above that shows up to 6 meters. I was looking at another earlier today and there's at least 3 times as much thin(0-1.5 meter) ice to melt ice to melt out than 2007 remaining. We could go to 3.7-3.9 million sq this year...
 
Last edited:
Mathew, did you watch the presentation by Professor Jennifer Francis?

[ame=http://www.youtube.com/watch?v=RtRvcXUIyZg]Weather and Climate Summit - Day 5, Jennifer Francis - YouTube[/ame]

She is a meteoroligist and has some very interesting things to say.
 

Forum List

Back
Top