Oddball
Unobtanium Member
[ame=http://www.youtube.com/watch?v=nPL7nN99jno]Gloom, Despair and Agony on Me - YouTube[/ame]
Follow along with the video below to see how to install our site as a web app on your home screen.
Note: This feature may not be available in some browsers.

The NCDC publishes great media:
Global Climate Change Indicators
How do we know the Earth's climate is warming?
Thousands of land and ocean temperature measurements are recorded each day around the globe. This includes measurements from climate reference stations, weather stations, ships, buoys and autonomous gliders in the oceans. These surface measurements are also supplemented with satellite measurements.
These measurements are processed, examined for random and systematic errors, and then finally combined to produce a time series of global average temperature change. A number of agencies around the world have produced datasets of global-scale changes in surface temperature using different techniques to process the data and remove measurement errors that could lead to false interpretations of temperature trends.
The warming trend that is apparent in all of the independent methods of calculating global temperature change is also confirmed by other independent observations, such as the melting of mountain glaciers on every continent, reductions in the extent of snow cover, earlier blooming of plants in spring, a shorter ice season on lakes and rivers, ocean heat content, reduced arctic sea ice, and rising sea levels.

Global average temperature is one of the most-cited indicators of global climate change, and shows an increase of approximately 1.4°F since the early 20th Century. The global surface temperature is based on air temperature data over land and sea-surface temperatures observed from ships, buoys and satellites.
There is a clear long-term global warming trend, while each individual year does not always show a temperature increase relative to the previous year, and some years show greater changes than others. These year-to-year fluctuations in temperature are due to natural processes, such as the effects of El Ninos, La Ninas, and the eruption of large volcanoes. Notably, the 20 warmest years have all occurred since 1981, and the 10 warmest have all occurred in the past 12 years.

Surface temperatures averaged across the U.S. have also risen. While the U.S. temperature makes up only part of the global temperature, the rise over a large area is not inconsistent with expectations in a warming planet. Because the U.S. is just a fraction of the planet, it is subject to more year-to-year variability than the planet as a whole. This is evident in the U.S. temperature trace.

Global mean sea level has been rising at an average rate of approximately 1.7 mm/year over the past 100 years (measured from tide gauge observations), which is significantly larger than the rate averaged over the last several thousand years.
Since 1993, global sea level has risen at an accelerating rate of around 3.5 mm/year. Much of the sea level rise to date is a result of increasing heat of the ocean causing it to expand. It is expected that melting land ice (e.g. from Greenland and mountain glaciers) will play a more significant role in contributing to future sea level rise.

While ocean heat content varies significantly from place to place and from year-to-year (as a result of changing ocean currents and natural variability), there is a strong trend during the period of reliable measurements. Increasing heat content in the ocean is also consistent with sea level rise, which is occurring mostly as a result of thermal expansion of the ocean water as it warms.

Northern Hemisphere average annual snow cover has declined in recent decades. This pattern is consistent with warmer global temperatures. Some of the largest declines have been observed in the spring and summer months.
Warming temperatures lead to the melting of glaciers and ice sheets. The total volume of glaciers on Earth is declining sharply. Glaciers have been retreating worldwide for at least the last century; the rate of retreat has increased in the past decade.
Only a few glaciers are actually advancing (in locations that were well below freezing, and where increased precipitation has outpaced melting). The progressive disappearance of glaciers has implications not only for a rising global sea level, but also for water supplies in certain regions of Asia and South America.
One way climate changes can be assessed is by measuring the frequency of events considered "extreme" (among the most rare of temperature, precipitation and storm intensity values). The Climate Extremes Index (CEI) value for the contiguous United States is an objective way to determine whether extreme events are on the rise. The figure to the left shows the the number of extreme climate events (those which place among the most unusual of the historical record) has been rising over the last four decades.
How do we know humans are the primary cause of the warming?
A large body of evidence supports the conclusion that human activity is the primary driver of recent warming. This evidence has accumulated over several decades, and from hundreds of studies. The first line of evidence is our basic physical understanding of how greenhouse gases trap heat, how the climate system responds to increases in greenhouse gases, and how other human and natural factors influence climate.
The second line of evidence is from indirect estimates of climate changes over the last 1,000 to 2,000 years. These estimates are often obtained from living things and their remains (like tree rings and corals) which provide a natural archive of climate variations. These indicators show that the recent temperature rise is clearly unusual in at least the last 1,000 years.
The third line of evidence is based on comparisons of actual climate with computer models of how we expect climate to behave under certain human influences. For example, when climate models are run with historical increases in greenhouse gases, they show gradual warming of the Earth and ocean surface, increases in ocean heat content, a rise in global sea level, and general retreat of sea ice and snow cover. These and other aspects of modeled climate change are in agreement with observations.
Global climate models clearly show the effect of human-induced changes on global temperatures. The blue band shows how global temperatures would have changed due to natural forces only (without human influence). The pink band shows model projections of the effects of human and natural forces combined. The black line shows actual observed global average temperatures.
The close match between the black line and the pink band indicates that observed warming over the last half-century cannot be explained by natural factors alone, and is instead caused primarily by human factors.

Over the last 800,000 years, natural factors have caused the atmospheric carbon dioxide (CO2) concentration to vary within a range of about 170 to 300 parts per million (ppm). The concentration of CO2 in the atmosphere has increased by roughly 35 percent since the start of the industrial revolution.
Globally, over the past several decades, about 80 percent of human-induced CO2 emissions came from the burning of fossil fuels, while about 20 percent resulted from deforestation and associated agricultural practices. In the absence of strong control measures, emissions projected for this century would result in the CO2 concentration increasing to a level that is roughly 2 to 3 times the highest level occurring over the glacial-interglacial era that spans the last 800,000 or more years.

The amount of solar energy received at the top of our atmosphere has followed its natural 11-year cycle of small ups and downs, but with no net increase. Over the same period, global temperature has risen markedly. This indicates that it is extremely unlikely that solar influence has been a significant driver of global temperature change over several decades.
So speaks the NCDC, boys and girls. Global warming is accelerating, AGW is the reason, sea levels are rising, and there is HELL TO PAY. Come and get it.

Bitch, your graph is modestly interesting, since it shows what a piece of shit you are, which could stink for millions of years, but your latest load is of no practical use.
[ It isn't anything but an unreferenced piece of shit, which you loaded, without explanation of the plots or the calibration of the lines, and it is on its side, which is typical of a wingpunk-fucktard, like you, who is full of shit, so we all have to know about it.
What could be gayer, than you are?
You left off the Holocene, and you are too queer, to notice Anthrocene. Eat ancient shit; it'll make you big, strong, and queer as a three-dollar-bill, punk.
You didn't even load something, with both measurements listed. You may have found a double plot of CO2 and temperature, but you don't load all the rap, from your site or a link, since you are a stupid, punkass Wienerbitch. Try this shit at your Log Cabin buddies.

Baffle 'em with bullshit, and get laid, with your own kind, asshole.
Then the seas will go up and over, on major coastal cities. We could lose a lot of Florida and big parts of NOLA and other US cities, by 2050, if this goes as fast as it could. Too bad anybody with Crapforbrains won't prepare.[/I][/B]

Those graphs of yours are shit, Wienerbitch.
You are a fecophile, who picks bad proxy media, about long-past timelines.
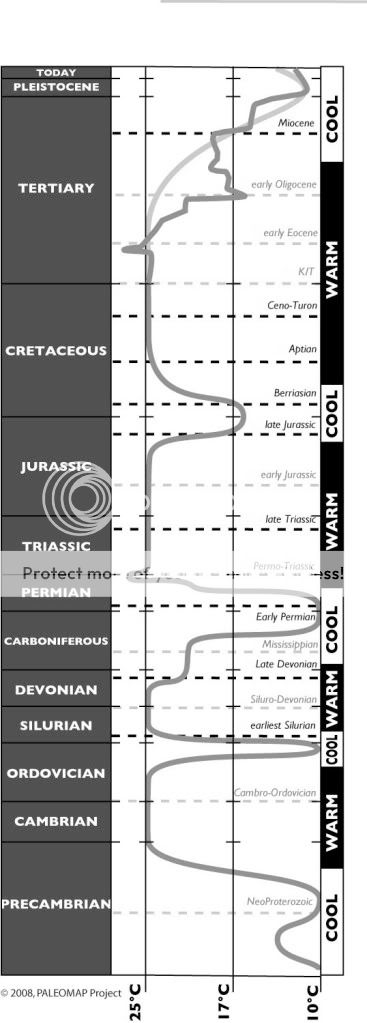
Your latest graph ends at the Cenozoic Period.
A new one on me Wirebender............now the k00ks are throwing bombs using the beetle to hype the angst!!! Geee........that should get people real alarmed.
A new one on me Wirebender............now the k00ks are throwing bombs using the beetle to hype the angst!!! Geee........that should get people real alarmed.
Got to say, every time I think they have reached a new low on the stupid-o-meter, one of them comes along and sets the bar at a whole new low. And not a single one of them can actually discuss the science and those who do routinely violate the various laws of physics with their "explanations".
But they are indeed good at posting up 1,000 times recycled science links!!!
But they are indeed good at posting up 1,000 times recycled science links!!!
They are unfortunate victims of the very same error cascade that has ruined climate science and done nearly irreprable damage to science as a whole. They unfortunately don't know enough to catch the foundational errors climate science has made and simply believe as opposed to know.
But they are indeed good at posting up 1,000 times recycled science links!!!
= THE DEFINITION OF A MENTAL CASE.
When you do things over and over and over and over and over and still expect a different outcome.
And Wire..........check this out...........cars being powered by natural gas to replace electric cars.
So much winning..............
What kind of shithead writes this, with tons of smileys, where science is discussed?