The scandal of fiddled global warming data

bripat9643

Diamond Member
Apr 1, 2011
169,997
47,202
2,180
I thought it might be useful to re-educate everyone on how the priesthood of the AGW cult has been caught red-handed fudging the data

The scandal of fiddled global warming data - Telegraph

The US has actually been cooling since the Thirties, the hottest decade on record

When future generations try to understand how the world got carried away around the end of the 20th century by the panic over global warming, few things will amaze them more than the part played in stoking up the scare by the fiddling of official temperature data. There was already much evidence of this seven years ago, when I was writing my history of the scare, The Real Global Warming Disaster. But now another damning example has been uncovered by Steven Goddard’s US blog Real Science, showing how shamelessly manipulated has been one of the world’s most influential climate records, the graph of US surface temperature records published by the National Oceanic and Atmospheric Administration (NOAA).

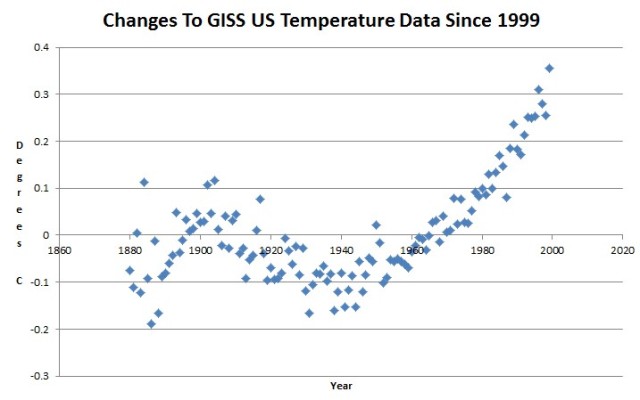
Goddard shows how, in recent years, NOAA’s US Historical Climatology Network (USHCN) has been “adjusting” its record by replacing real temperatures with data “fabricated” by computer models. The effect of this has been to downgrade earlier temperatures and to exaggerate those from recent decades, to give the impression that the Earth has been warming up much more than is justified by the actual data. In several posts headed “Data tampering at USHCN/GISS”, Goddard compares the currently published temperature graphs with those based only on temperatures measured at the time. These show that the US has actually been cooling since the Thirties, the hottest decade on record; whereas the latest graph, nearly half of it based on “fabricated” data, shows it to have been warming at a rate equivalent to more than 3 degrees centigrade per century.

1998changesannotated.gif


iceland-1.gif


screenhunter_26-jun-22-11-20.jpg
 
It's positively amazing how most of this sort of news has to come from London, England news sources. The liberal media in this country remains a freaking JOKE.
 
It's positively amazing how most of this sort of news has to come from London, England news sources. The liberal media in this country remains a freaking JOKE.
Have you noticed how Mamooth has slunk away since I posted that?
 
It's positively amazing how most of this sort of news has to come from London, England news sources. The liberal media in this country remains a freaking JOKE.
Have you noticed how Mamooth has slunk away since I posted that?
There will be a whole shitpile (literally) bunch of liberals slinking away from this thread.
 
Normal people, when they see the whole planet disagreeing with them, will consider that they probably messed up themselves. Cultists, however, will instead conclude the whole world is conspiring against them.

Bri and Porker are such hardcore cultists. They weren't reasoned into their positions, so they can't be reasoned out of them.

Bri also obviously displays symptoms of histrionic personality disorder. He's desperate for attention, and throws tantrums to get it.
 
Rainbow_GlacierNP090109-_199_Scur.jpg
In Glacier National Park (GNP), MT some effects of global climate change are strikingly clear. Glacier recession is underway, and many glaciers have already disappeared. The retreat of these small alpine glaciers reflects changes in recent climate as glaciers respond to altered temperature and precipitation. It has been estimated that there were approximately 150 glaciers present in 1850, and most glaciers were still present in 1910 when the park was established. In 2010, we consider there to be only 25 glaciers larger than 25 acres remaining in GNP. A computer-based climate model predicts that some of the park’s largest glaciers will vanish by 2030 (Hall and Fagre, 2003). This is only one model prediction but, if true, then the park’s glaciers could disappear in the next several decades. However, glacier disappearance may occur even earlier, as many of the glaciers are retreating faster than their predicted rates.

Retreat of Glaciers in Glacier National Park Northern Rocky Mountain Science Center NOROCK

Why, it is cooling so fast in the US that the glaciers of Glacier National Park are almost gone.
 
Alpine Glacier Mass Balance

What is mass balance?
Crucial to the survival of a glacier is its mass balance, the difference between accumulation and ablation (melting and sublimation). Climate change may cause variations in both temperature and snowfall, causing changes in mass balance. Changes in mass balance control a glacier's long term behavior. It is the most sensitive climate indicator on a glacier. A glacier with a sustained negative balance is out of equilibrium and will retreat. A glacier with a sustained positive balance is out of equilibrium and will advance.
What has research proven?


We have measured the mass balance on ten glaciers in the North Cascades each year since 1984. The cumulative mass loss has been substantial. Annual mass balance is the most sensitive annual glacier climate indicator. North Cascade glaciers annual balance has averaged -0.51 m/a of water equivalent from 1984-2010 a cumulative loss of over13.25m in glacier thickness. This represents a net loss of ice thickness exceeding 14 m or 20-40 % of their total volume since 1984 due to negative mass balances. The trend in mass balance is becoming more negative which is fueling more glacier retreat and thinning note figure at right. The map at right indicates the location of the glaciers (green circles) where we monitor annual glacier mass balance.

hmmmmmmmmm........... That cooling seems to be melting the glaciers in the Cascades, also.


compare_dana.jpg


Dana Glacier (unofficial name) in 1883 (left, photo by I.C. Russell, USGS) and in 2004 (right, photo by Hassan Basagic)

compare_lyell.jpg

Lyell Glacier in 1904 (left, YNP) and in 2003 (right, photo by Hassan Basagic)

A collection of additional Sierra Nevada comparison photos can be found here.

One strange cooling you folks are posititing.
 
First saw the glaciers of the North Cascades in the mid-70's. Have seen them recede steadily since then with my own eyes. Is that screwing with the data?
 
First saw the glaciers of the North Cascades in the mid-70's. Have seen them recede steadily since then with my own eyes. Is that screwing with the data?


Then the obvious question becomes...............why are they screwing with the data then??

I don't think anybody in here is saying there isn't warming happening. But lets face it.........blaming it on CO2 is absolutely preposterous ( trace gas - a hail Mary pass guess ) and more to the point, pushing this hysterical response to such a small increase in warming is not grounded in reasoned judgment.

Unfortunately Ray......MWP decimates all the arguments which is why Gore has NEVER debated the issue.
 
Its amazing how old crock points to glaciers but then refuses to show the glaciers around the world which are increasing. But then that is how the left and alarmists operate. They show only that which somehow would prove their contentions.. Its kind of like Antarctica when we are told only to look at the Arctic..
 
Hey Bri- I was going to wish you good luck yesterday with trying to get people to care about temp data 'corrections' but I didn't want to jinx you. I see old rocks spammed your thread with glacier BS to deflect from the topic. I suppose he wants the Little Ice Age back, because he knows that is the only way to get glaciers to grow again.

As to the data tampering, it is done in different ways by the different global temp products in different areas of the world. If someone points out one mistake they simply deflect to a calculation somewhere else. The screw up in Iceland is caused by a different flaw than the screw up in the US. The layers of adjustments can all be explained one a one-to-one basis, it is the combinations of adjustments that go out of whack.

An Aussie just took a look at Alice Springs and all the stations within a thousand kilometers, more than half of the continent. The stations on average had very close to flat trends. Yet Stokes over at Moyhu can slow you how to manipulate them into a sharply rising trend. The magicians at GISS and BEST have a big headstart. Taking down this fraud will be difficult and I don't see how it can be done without full time statisticians and access to the data and previous calculations. Someone just FOI ed GISS and were told it would cost 260,000 for the info. I realize that is a pittance for the warmists side but I don't see any amateur volunteers being able to produce the cash, and even then I doubt the info would be complete.
 
Its amazing how old crock points to glaciers but then refuses to show the glaciers around the world which are increasing. But then that is how the left and alarmists operate. They show only that which somehow would prove their contentions.. Its kind of like Antarctica when we are told only to look at the Arctic..
The incriminating fact is that most of the retreat occurred before 1950. I went to Glacier national park in 1970 when I was a kid, and the glaciers were mostly gone then. Old Fraud is engaging in cherry picking of the data. That's is modus operandi.
 
australia_2.png


average_raw.png


average_adjusted.png


for edthecynic who doesnt like non anomalies.

alice_anomalies.png


anyways, a large piece of Australia doesnt seem to be warming much at all.

here are the links moyhu Central Australian warming and Temperature adjustments in Australia Climate Etc.

Stokes thinks this is a better graph of central Australia warming-

roman.png


I think he should have used the same scale but that is a nitpick.

mears plots up all the staions on one graph which definitely shows the late 70s cooling which disappeared on so many global temp products-

alice_dTspag.png


Stokes thinks we get more information from smoothing the data-

spag.png

the whole thing is quite interesting. as usual, the comments are as informative as the actual article.
 
Reference the fable "The Boy Who Cried Wolf".

The denier cult has been caught lying so big and so often, everyone now simply assumes they lie about everything, so nobody pays them even a bit of attention.

It's hard to unshit the bed, as deniers are finding out. And they're not getting any sympathy from people who didn't shit their own bed.

I don't know how you can take getting so thoroughly pummelled for days and days:

427575898_knockout_xlarge.jpeg
 
"The
timing
of
year
is
important
to
glacier
photos
as
only
late
summer
photos
are
useful,
when
the
summer
has
melted
the
previous
winter’s
snow
exposing
the
glacier
ice
and
before
new
snow
begins
to
accumulate
.
Great
effort
was
made
to
determine
the
exact
photo
locations
.
Many
photos
were
difficult
to
relocate
as
the
ice
surface
has
lowered,
making
some
original
locations
inaccessible
.
Many
historic
and
modern
images
have
been
digitally
stitched
together."

http://web.pdx.edu/~basagic/HiSierraRepeatPhoto.pdf

Translation: we're not sure if this is the same place so we just guessed and then did some photo-shopping.

:boohoo:
 
fs20093046_fig05.png


Figure 5. Cumulative net balance of South Cascade, Wolverine, and Gulkana Glaciers (Josberger and others, 2007). Densities of snow and ice differ considerably and before glacier-average thickness changes in each material can be summed to the net balance, the changes must be converted to a common basis. By custom, the common basis is "meters water equivalent" (MWEQ), which is the thickness of water that would result from melting a given thickness of snow or ice.


Fifty years of U.S. Geological Survey (USGS) research on glacier change shows recent dramatic shrinkage of glaciers in three climatic regions of the United States. These long periods of record provide clues to the climate shifts that may be driving glacier change.

The USGS Benchmark Glacier Program began in 1957 as a result of research efforts during the International Geophysical Year (Meier and others, 1971). Annual data collection occurs at three glaciers that represent three climatic regions in the United States: South Cascade Glacier in the Cascade Mountains of Washington State; Wolverine Glacier on the Kenai Peninsula near Anchorage, Alaska; and Gulkana Glacier in the interior of Alaska (fig. 1).

fs20093046_fig01.png


USGS Fact Sheet 2009 3046 Fifty-Year Record of Glacier Change Reveals Shifting Climate in the Pacific Northwest and Alaska USA

Glaciers are the ultimate arbiter in the debate. If the weather is colder, as in the little ice age, they advance. If the weather is warmer, they retreat. Worldwide, almost all are in retreat.
 

Forum List

Back
Top