Solar for 2015

Old Rocks

Diamond Member
Oct 31, 2008
63,085
9,749
2,040
Portland, Ore.
Key Figures
  • The U.S. installed 1,306 MWdc of solar PV in Q1 2015, marking the sixth consecutive quarter in which the U.S. added more than 1 GWdc of PV installations.
  • Through Q1 2015, nearly one-fourth of cumulative residential solar installations have now come on-line without any state incentive.
  • The residential and utility PV market segments each added more capacity than the natural gas industry brought on-line in Q1 2015.
  • Collectively, more than 51% of all new electric generating capacity in the U.S. came from solar in Q1 2015.
  • Of the 68 MWdc of community solar installations to date, more than one-third of that total has come on-line since 2014.
  • More than 5 GWdc of centralized PV has now been procured by utilities based on solar’s economic competitiveness with fossil-fuel alternatives.
  • We forecast that PV installations will reach 7.9 GWdc in 2015, up 27% over 2014. Growth will occur in all segments, but will be most rapid in the residential market.
  • 2014 was the largest year ever for concentrating solar power, with 767 MWac brought on-line. The next notable CSP project slated for completion is SolarReserve’s 110 MWac Crescent Dunes, which entered the commissioning phase in 2014 and is expected to become fully operational before the end of 2015.
Solar Market Insight Report 2015 Q1 SEIA

Looks like our President bet on the right horse, after all. How does it feel to have egg all over your face for you people that stated solar would never work?
 
http://energy.gov/sites/prod/files/...ility-Scale_PV_Solar_Markets_February2015.pdf

NOTE FROM THE EXECUTIVE DIRECTOR
The Department of Energy’s Loan Programs Oce (LPO) was instrumental in launching the utility-scale photovoltaic (PV) solar industry in the United States. In 2009, there was not a single PV solar facility larger than 100 megawatts (MW) operating in the United States. Despite
growing demand for this clean, renewable energy source, developers faced challenges securing the financing necessary to build these large projects. LPO stepped in to address this market barrier by providing more than $4.6 billion in loan guarantees to support construction of the first five utility-scale PV solar facilities larger than 100 MW in the United States. These loan guarantees helped transform U.S. energy production and paved the way for the fastest growing sector of the solar industry. Today, utility-scale PV solar has the capacity to produce more than 8,100 MW of electricity – which is enough clean energy to power nearly 1.4 million average American homes.
The rapid growth of solar energy is lowering costs for consumers, creating jobs, and cutting the harmful emissions that cause climate change.

Peter W. Davidson
Executive Director
February 2015

Definately earned the right to brag.
 
FIGURE: U.S. PV Installations, Q1 2010-Q1 2015
q1-2015pvinstall_582_343.png


Fueled by Growth in Residential Solar US Installs 1.3GW of PV in Q1 2015 Greentech Media

Wish I had an investment that grew in this manner.
 
In 50 years they'll be laughing at and our "quaint" oil powered systems.
 
Key Figures
  • The U.S. installed 1,306 MWdc of solar PV in Q1 2015, marking the sixth consecutive quarter in which the U.S. added more than 1 GWdc of PV installations.
  • Through Q1 2015, nearly one-fourth of cumulative residential solar installations have now come on-line without any state incentive.
  • The residential and utility PV market segments each added more capacity than the natural gas industry brought on-line in Q1 2015.
  • Collectively, more than 51% of all new electric generating capacity in the U.S. came from solar in Q1 2015.
  • Of the 68 MWdc of community solar installations to date, more than one-third of that total has come on-line since 2014.
  • More than 5 GWdc of centralized PV has now been procured by utilities based on solar’s economic competitiveness with fossil-fuel alternatives.
  • We forecast that PV installations will reach 7.9 GWdc in 2015, up 27% over 2014. Growth will occur in all segments, but will be most rapid in the residential market.
  • 2014 was the largest year ever for concentrating solar power, with 767 MWac brought on-line. The next notable CSP project slated for completion is SolarReserve’s 110 MWac Crescent Dunes, which entered the commissioning phase in 2014 and is expected to become fully operational before the end of 2015.
Solar Market Insight Report 2015 Q1 SEIA

Looks like our President bet on the right horse, after all. How does it feel to have egg all over your face for you people that stated solar would never work?
So, what percent of total usage comes from Solar now?
What is the payback of a typical residential system?
 
Key Figures
  • The U.S. installed 1,306 MWdc of solar PV in Q1 2015, marking the sixth consecutive quarter in which the U.S. added more than 1 GWdc of PV installations.
  • Through Q1 2015, nearly one-fourth of cumulative residential solar installations have now come on-line without any state incentive.
  • The residential and utility PV market segments each added more capacity than the natural gas industry brought on-line in Q1 2015.
  • Collectively, more than 51% of all new electric generating capacity in the U.S. came from solar in Q1 2015.
  • Of the 68 MWdc of community solar installations to date, more than one-third of that total has come on-line since 2014.
  • More than 5 GWdc of centralized PV has now been procured by utilities based on solar’s economic competitiveness with fossil-fuel alternatives.
  • We forecast that PV installations will reach 7.9 GWdc in 2015, up 27% over 2014. Growth will occur in all segments, but will be most rapid in the residential market.
  • 2014 was the largest year ever for concentrating solar power, with 767 MWac brought on-line. The next notable CSP project slated for completion is SolarReserve’s 110 MWac Crescent Dunes, which entered the commissioning phase in 2014 and is expected to become fully operational before the end of 2015.
Solar Market Insight Report 2015 Q1 SEIA

Looks like our President bet on the right horse, after all. How does it feel to have egg all over your face for you people that stated solar would never work?
So, what percent of total usage comes from Solar now?
What is the payback of a typical residential system?

In 2014 it was 0.4% right now it must be close to 0.5%
What is U.S. electricity generation by energy source - FAQ - U.S. Energy Information Administration EIA

With the current price of solar kits the payback time ( considering you are still connected to the grid ) is 10 years ( unless you live in Hawaii where electricity is VERY expensive there it is close to 5 years ) .

DIY Solar Panel Kits Grid-Tied Solar Power Installation Kit for Homes

If you want to go off-grid then the ROI will probably jump to 18 years. The cheapest energy storage system I've seen so far is hydraulic storage which is expensive for small scale ( it requires water containers or concrete, a hydraulic pump, a motor and a generator).

Hydraulic Energy Storage - Another Way to Use Gravity Intelligent Utility
 
Tesla is currently selling a home battery system;

Tesla Powerwall

7.5 Kw/hr at somewhere in the neighborhood of $3000.
Hi Old Rocks,
Hidraulic pumping is generally cheaper and more eco-friendly. The downside is the extra space you need and the material.Basically you have a dead weight which is elevated by a hydraulic pump and water. When you want to generate electricity you use the dead weight to pump down the water and generate electricity at 80% efficiency , no waste , no acids, no rare metals involved.
Of course , the downside is you need some extra 1000 sq foot for the system, plus rubble. It is definitively not an option for people living in an appartment.
The tessla battery is an real deal for anyone using more than 10 kwh / day.
 
Of course, being from Eastern Oregon, anything that uses water is problematic. Water can be a precious and rare commodity there in years like this year. But yes, anything that uses just water, wind, or sun to create or store electricity is the cleanest choice. Tesla does provide a good alternative that was not previously available at this price, however.
 
In 50 years they'll be laughing at and our "quaint" oil powered systems.
Not according to the EIA. :slap:

EIA-AEO2011-Figure-2-Early-Release-Overview-Projected-Fuel-Mix-for-Electricity-Generation.jpg


http://www.redfishtech.com/catch_of_the_day/2011/01/green-energy-trends-eia/
A couple of objections:
1) The chart covers only the next 20 years ( not 50) .
2) Coal yea, sure , it is VERY cheap, gas ... I'm not so sure , I suspect gas production is being subsidized by zirp and expensive oil from fracking.
So, the EIA is able to project out to 20 years but your crystal ball extends to the next 50.

Brilliant. :slap:

Gas production is not subsidized. BTW what is "zirp"? :dunno:
 
So, the EIA is able to project out to 20 years but your crystal ball extends to the next 50.

Brilliant. :slap:

Gas production is not subsidized. BTW what is "zirp"? :dunno:
No , I didn't say anything about having a crystal ball. Just that the proyection doesn't cover 50 years.
ZIRP - Zero interest rate policy.
But you yourself covered the ensuing 50 years in your above post.

So what gives?

You got any supportive references?
The comment was posted by Mr Clean.
My post was only to point out that your source didn't cover the 50 years mentioned by Mr. Clean
Regardless, EIA missed the shale oil boom and bust , so no crystal ball there either.
Solar is mature for domestic use . IF you stay on the grid you'll get to break-even price in seven years.
Solar will grow fueled by the ever increasing prices of fosil fuels.
The shale boom has not "busted". :slap:

BTW- this evening I spoke with a friend who is the Director of Facilities Planning & Mgmt at the local university. A classroom building was recently constructed next to the school's "renewable" energy center. I asked him why, with the gently sloping and south-facing roofline, it is not covered in solar panels. He said that the labor cost alone is $50/hour to have that shit installed and they can't even afford that. :lol:

Right, it hasn't busted... yet
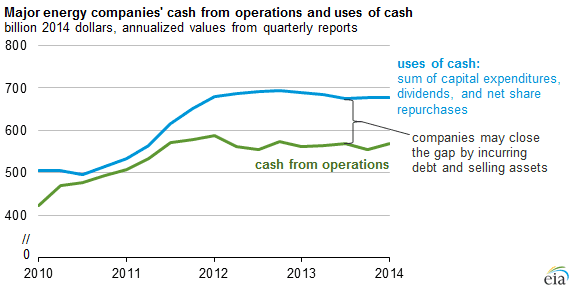
As cash flow flattens major energy companies increase debt sell assets - Today in Energy - U.S. Energy Information Administration EIA

main.png


It just hasn't been able to produce profits since 2010, even with oil price spiking at 100+ USD.
No wonder the fed has kept ZIRP. With 150 B of anual losses I don't think they'll be able to maintain operations for too long ,unless the barrel returns to its previous price in the next 12 months.

But in fact, I am hoping the oil price returns to 100+ or even to 120+, at that price solar becomes competitive
 
I'm 10 miles from the nearest electrical power source. When I built 12 years ago the electric utility wanted over a million dollars to bring in power to my community.

My solar system could be built today for around $2500. So far I've spent $120 on maintenance. And no utility bill.

I must disclose that I'm an electrician and do the work myself. If you have to hire the work done your cost will be higher.
 

Forum List

Back
Top