Record cold forcing rethink on global warming!

Is that supposed to denote that you don't understand my explanation?

If so I can't help you, that's about as clearly as I can tell you.
so pick a state, say Illinois and explain what the 60 represents.
1 being coldest and 125 being warmest 60 represents January 2019 being about in the middle, or average for January temps. It's not 60°, it's #60 out of 125.

Get it now?
nope, makes absolutely no sense. average temperature is average temperature, it isn't a 1 or 125. the number of days above and below average is all I need to know, so that chart means nothing but jack shit. Nor does it show any comparison to previous years at all.

30 days in January, were 15 above average or below average, how much above or below. useful data to show the month cold or warm. then show previous year. nope, the manipulators manipulate.

Number of cloudy days, number of snow days or rain days, wet days. we weren't supposed to get anymore snow, I recall. yet, that isn't true. it still snows. every prediction has failed bigly.
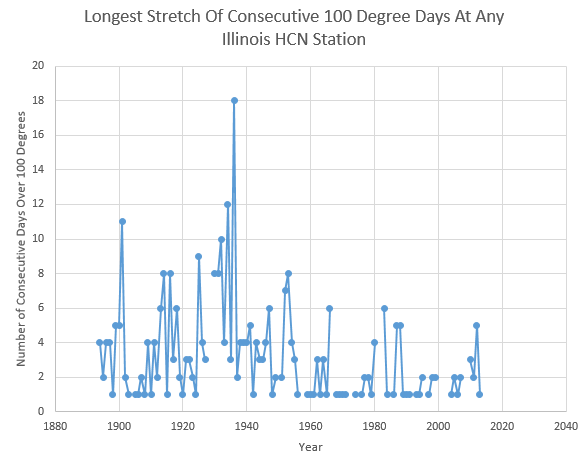
Its one pile of BS to cover up another pile of BS. This chart makes assumptions based on what base line? Where is the data to support that base line? What changes were made to the data since it was observed? why were the changes made? etc, etc, etc.... This is why adjusting the HCN data and throwing away the original set has made the whole record useless..

Its one huge pile of crap to cover up the lies.
They took 125 years worth of January average temps (that's each days temp ÷ 31, the number of days in January) and ranked them from coldest to warmest. It's not rocket science kids.

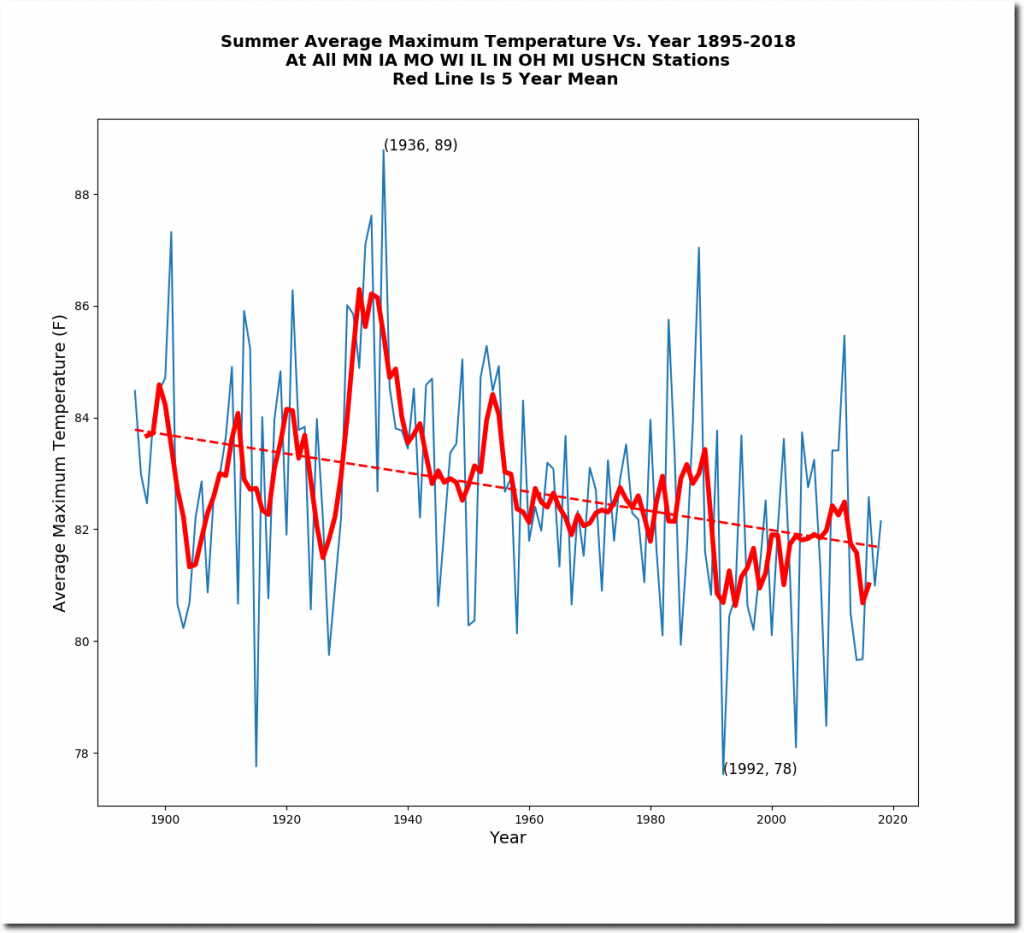
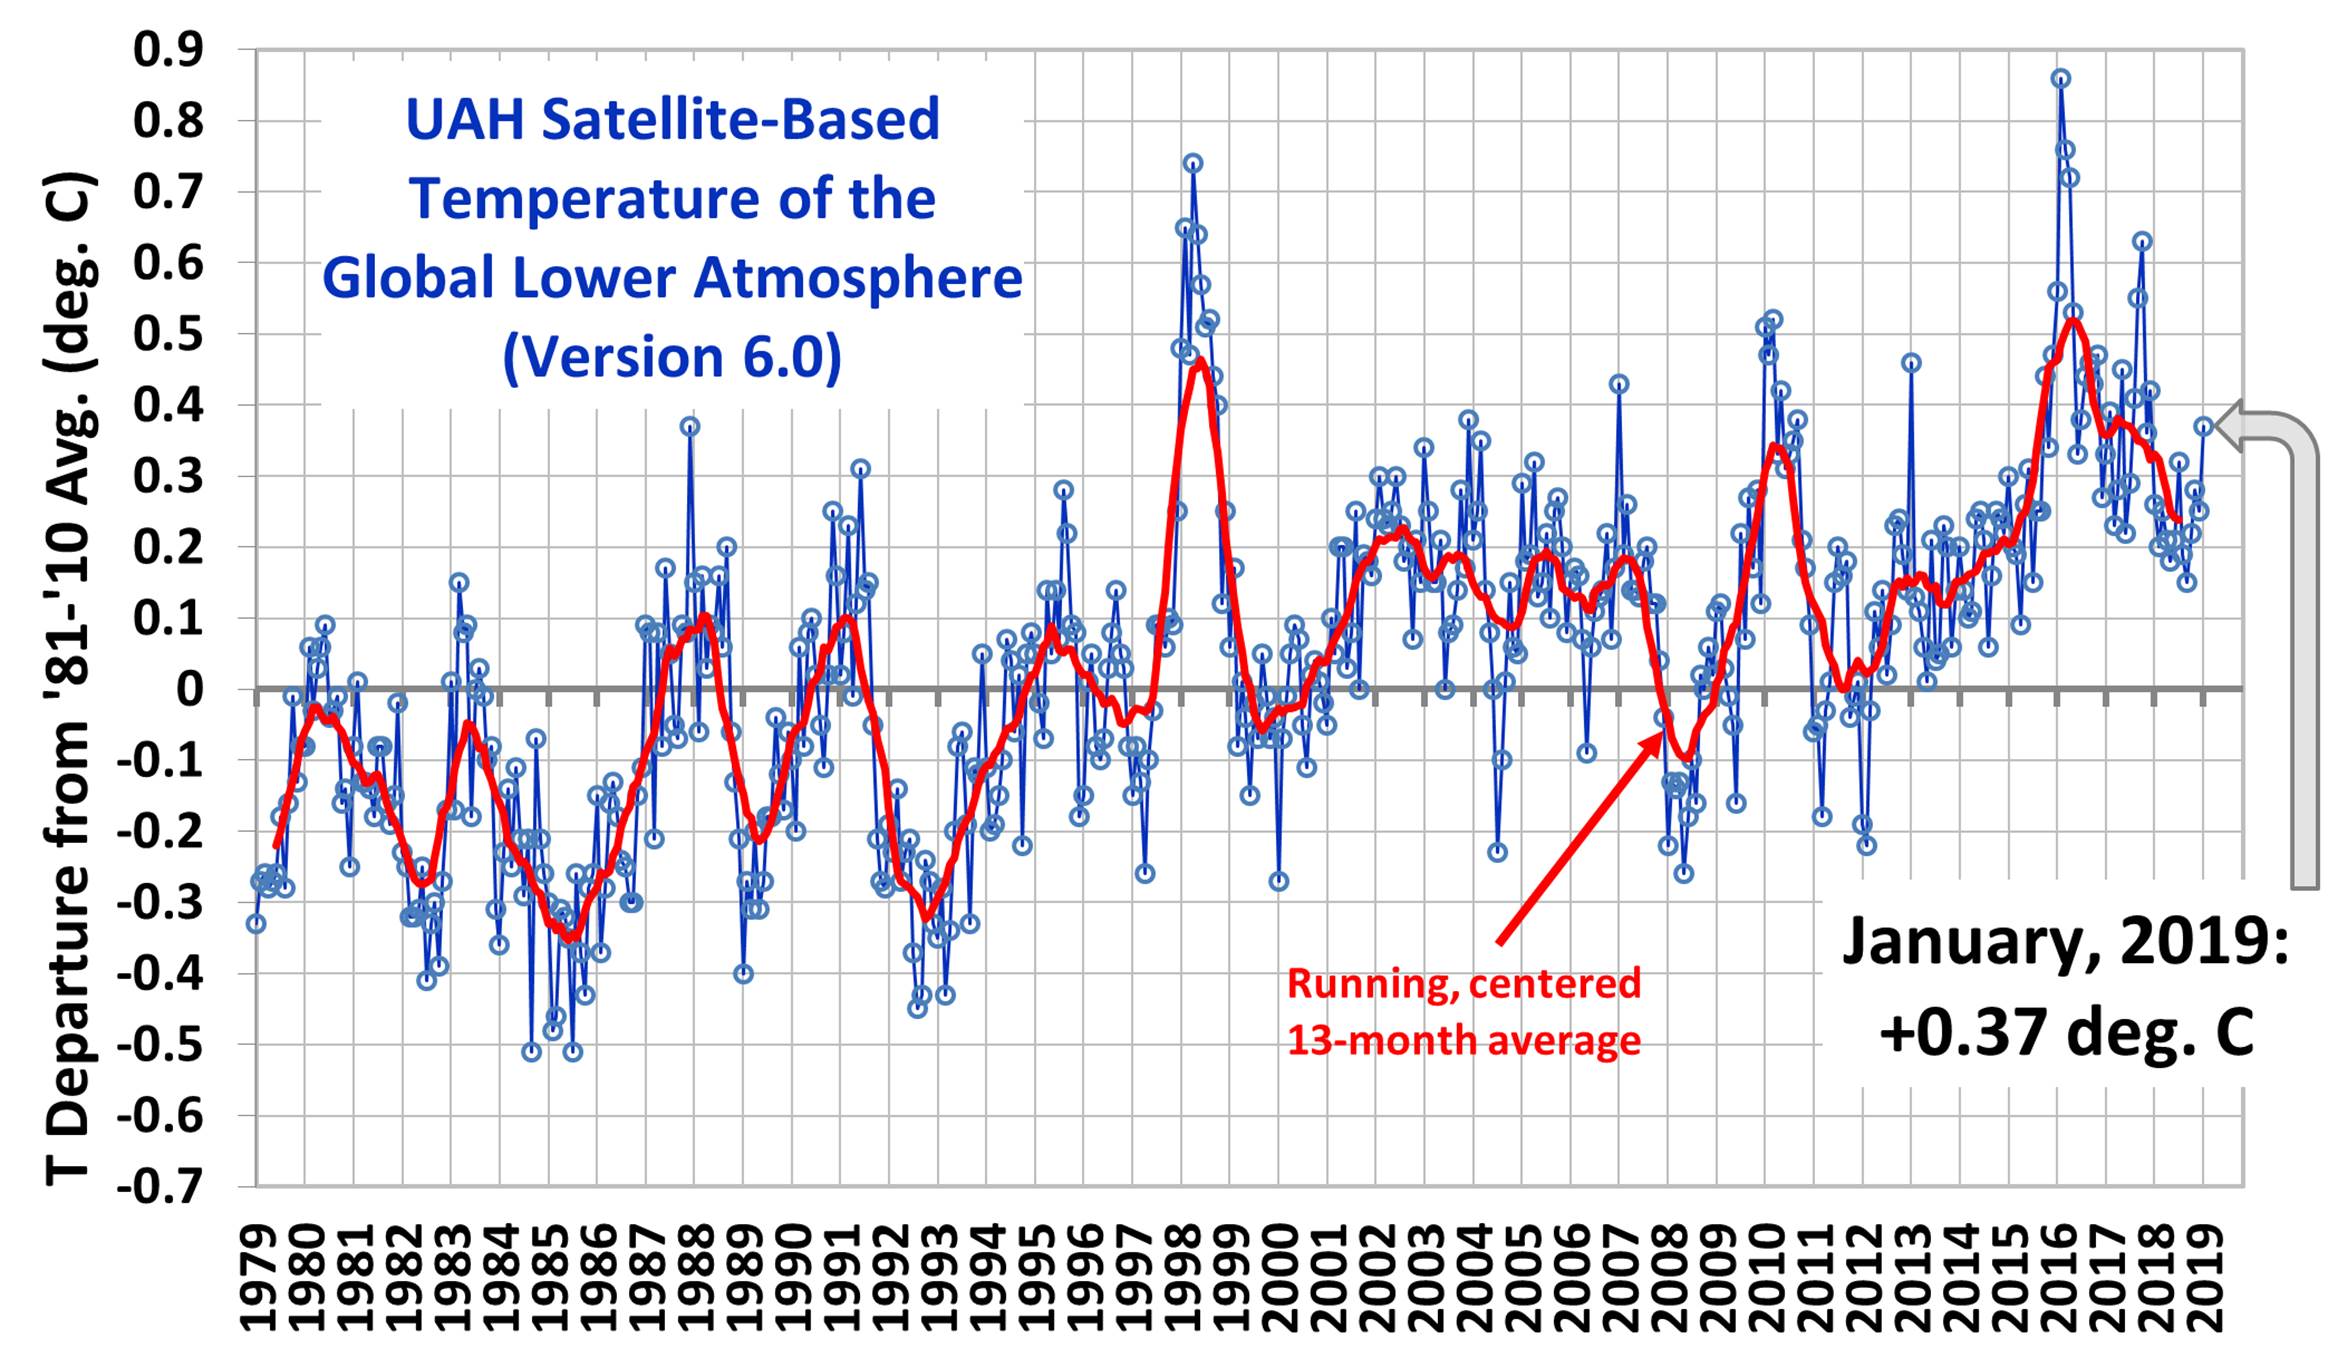
The real data don't support the claim...
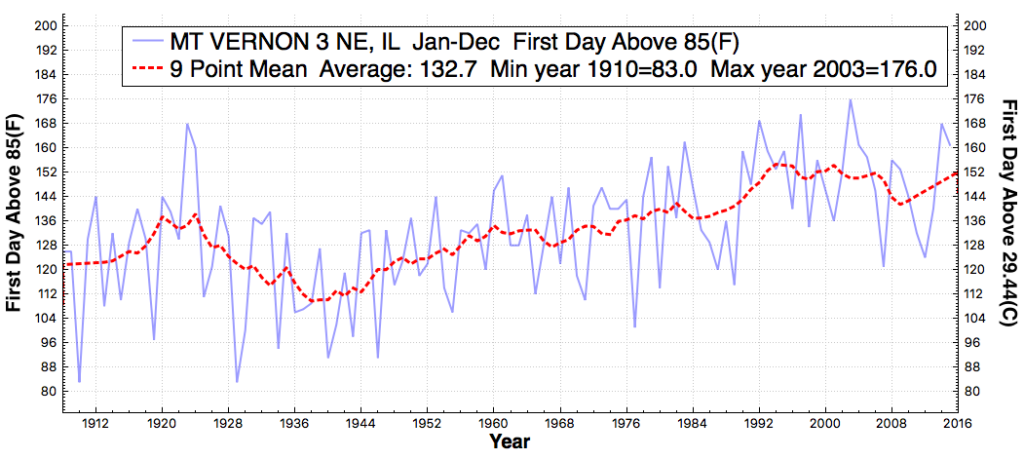
MTVERNON3NE_IL_FirstDayAboveMaximumTemperatureThreshold85F_Jan_Dec_1909_2015-1024x459.png

MTVERNON3NE_IL_LastDayAboveMaximumTemperatureThreshold85F_Jan_Dec_1909_2015-1024x459.png
2015-11-01-15-04-29.png

ScreenHunter_2858-Sep.-02-09.28.gif


Summer-1895-2018-Midwestlist-Red-Line-Is-5-Year-Mean-AverageMaximumTemperature-vs-Year_shadow-1024x933.png
 

Soooooo, how does atmospheric CO2 warm the ocean 700m deep, Mr. Science? You can phone Bill Nye
You've never heard of convection?

You're actually saying that the atmospheric CO2 generates enough heat to warm the oceans 700m deep? Do you have any idea at all of the amount of heat your need in the atmosphere just to warm the water 1m deep?

Crick once told us that it takes 3000 times the energy to warm equal volumes of water than air.

See why your glib answer fails?
Look up the word "convection" child. Have someone read the definition to you and explain, with pictures if necessary, what it is and what it does. Then you will understand.

Maybe.

On a good day.

If you're lucky.
Convection is what is warming Cali? REALLY?

Your an idiot...
I'd tell you not to be stupier than you have to be but I'm pretty sure it's too late.

Yes son, convection is why California is warmer than Kansas today, and also why the ocean is warming down to 700 feet. Things circulate. The air and the water don't just sit there.
 
so pick a state, say Illinois and explain what the 60 represents.
1 being coldest and 125 being warmest 60 represents January 2019 being about in the middle, or average for January temps. It's not 60°, it's #60 out of 125.

Get it now?
nope, makes absolutely no sense. average temperature is average temperature, it isn't a 1 or 125. the number of days above and below average is all I need to know, so that chart means nothing but jack shit. Nor does it show any comparison to previous years at all.

30 days in January, were 15 above average or below average, how much above or below. useful data to show the month cold or warm. then show previous year. nope, the manipulators manipulate.

Number of cloudy days, number of snow days or rain days, wet days. we weren't supposed to get anymore snow, I recall. yet, that isn't true. it still snows. every prediction has failed bigly.
Its one pile of BS to cover up another pile of BS. This chart makes assumptions based on what base line? Where is the data to support that base line? What changes were made to the data since it was observed? why were the changes made? etc, etc, etc.... This is why adjusting the HCN data and throwing away the original set has made the whole record useless..

Its one huge pile of crap to cover up the lies.
They took 125 years worth of January average temps (that's each days temp ÷ 31, the number of days in January) and ranked them from coldest to warmest. It's not rocket science kids.

The real data don't support the claim...
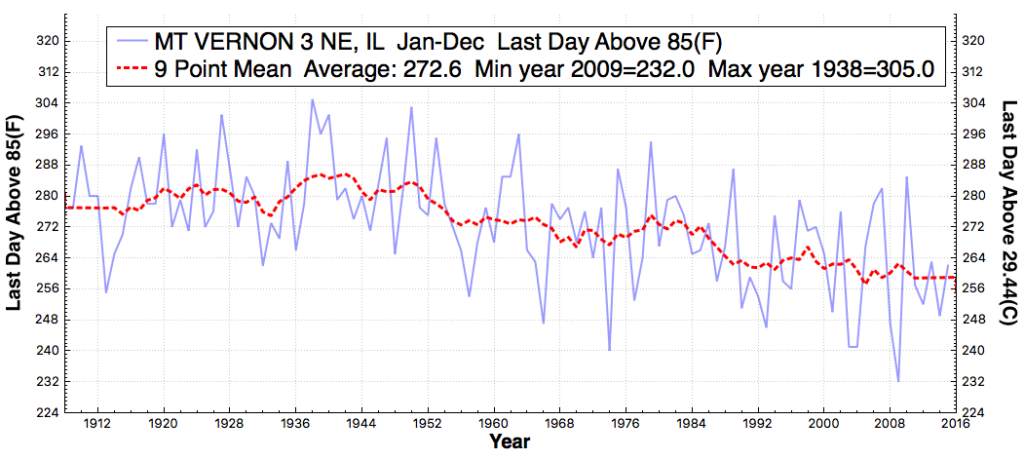
MTVERNON3NE_IL_FirstDayAboveMaximumTemperatureThreshold85F_Jan_Dec_1909_2015-1024x459.png

MTVERNON3NE_IL_LastDayAboveMaximumTemperatureThreshold85F_Jan_Dec_1909_2015-1024x459.png
2015-11-01-15-04-29.png

ScreenHunter_2858-Sep.-02-09.28.gif


Summer-1895-2018-Midwestlist-Red-Line-Is-5-Year-Mean-AverageMaximumTemperature-vs-Year_shadow-1024x933.png
Source less charts of no provenance.
 
1 being coldest and 125 being warmest 60 represents January 2019 being about in the middle, or average for January temps. It's not 60°, it's #60 out of 125.

Get it now?
nope, makes absolutely no sense. average temperature is average temperature, it isn't a 1 or 125. the number of days above and below average is all I need to know, so that chart means nothing but jack shit. Nor does it show any comparison to previous years at all.

30 days in January, were 15 above average or below average, how much above or below. useful data to show the month cold or warm. then show previous year. nope, the manipulators manipulate.

Number of cloudy days, number of snow days or rain days, wet days. we weren't supposed to get anymore snow, I recall. yet, that isn't true. it still snows. every prediction has failed bigly.
Its one pile of BS to cover up another pile of BS. This chart makes assumptions based on what base line? Where is the data to support that base line? What changes were made to the data since it was observed? why were the changes made? etc, etc, etc.... This is why adjusting the HCN data and throwing away the original set has made the whole record useless..

Its one huge pile of crap to cover up the lies.
They took 125 years worth of January average temps (that's each days temp ÷ 31, the number of days in January) and ranked them from coldest to warmest. It's not rocket science kids.

The real data don't support the claim...
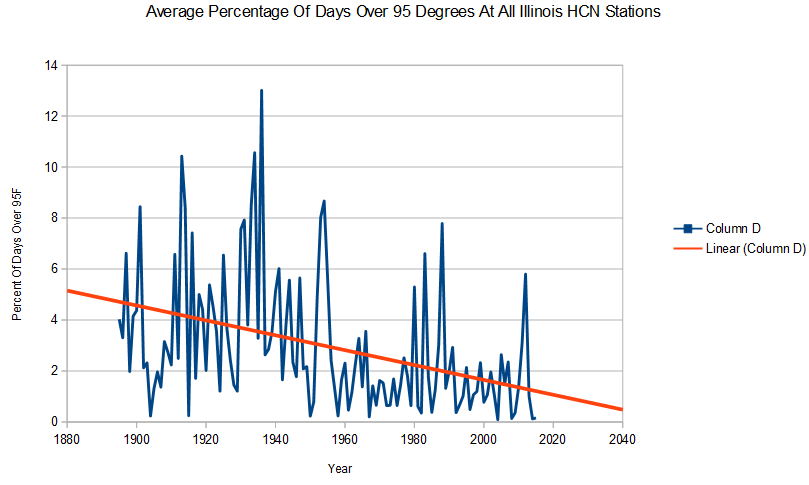
MTVERNON3NE_IL_FirstDayAboveMaximumTemperatureThreshold85F_Jan_Dec_1909_2015-1024x459.png

MTVERNON3NE_IL_LastDayAboveMaximumTemperatureThreshold85F_Jan_Dec_1909_2015-1024x459.png
2015-11-01-15-04-29.png

ScreenHunter_2858-Sep.-02-09.28.gif


Summer-1895-2018-Midwestlist-Red-Line-Is-5-Year-Mean-AverageMaximumTemperature-vs-Year_shadow-1024x933.png
Source less charts of no provenance.

Guess you don't know what HCN is... If you have some actual argument about the data, by all means lets hear it and provide some observed, measured data to support your complaint...

We both know that isn't going to happen though...don't we. Whoever gave you your opinion didn't prepare you to actually defend that position...
 

Forum List

Back
Top