Real Unemloyment Rate: 22.5%?

trying to get data for my own mad science, i've been annoyed by the BLS tracking only civilian non-institutionals. could the fate of the 20% balance be outside this characterization?

i like that the idea of tracking that ratio if it were easy to lump non-civilians in too.

Not that I fully understand what you are saying but when you have a 1% prison population they really are an important part of the employment picture. On the other hand I believe about half of those incarcerated in the US actually are employed. They should be counted either way.
they should be counted if you are trying to look at the losers in a shit job market. it is my criticism of reagan's unemployment rebound after the forever recessions in the early 80s. folks just picked up and moved to prison cells and welfare rolls, and off the unemployment map altogether. i dont think the BLS figures should be designed to paint the worst picture of unemployment possible. i was saying earlier that this figure is only valuable as a relative term: it was like this, now it is like this. it should line up with other state's practices on unemployment, which are nearly all more opaque and exclusive than the US, that i am aware.

if some shadow stats guy pulls a figure from his hat and declares that it is 27%, that is no more real than the BLS figure. the reality is in the same methodology compared to the same at two different intervals. i wonder what people mean when they say 'real' unemployment if they are not looking at a raw picture of total population to hours worked/40.
An FTE participation rate/potential labor force rate, I like it.
 
"The claim that the last recession started under Clinton is absolutely true

Tell it to the NBER. Meanwhile in reality that recession began a few months after Bush took office while the current recession began 9 months before Obama did.

Those are facts, Ma'am. Deal.

The Clinton recession started in 1999 & we have never recovered. That was 2 years before Bush took office. We have only had inflation since 1999 but no economic growth.
dj-au-ratio-mt.gif

The FDR tactics from the Great Depression haven't worked either. Bush tried them. He sent our military to fight 2 wars & allowed the inflationary subprime lending boom cause a huge amount of inflation. We deficit spent & increased entitlements. These are things that historians credited for bringing us out of the great depression. They did not work this time.

There are a huge amount of failed business owners that cannot collect unemployment & are not counted in the unemployment numbers. As high unemployment drags on large segments of the unemployed fall off of the unemployment rolls yet they are still unemployed. The work force has been shrinking even as the population has been growing.
 
The Clinton recession started in 1999 & we have never recovered. That was 2 years before Bush took office. We have only had inflation since 1999 but no economic growth.


Not according to the NBER and GDP stats

dsg230_500_350.jpg


Even the gold bugs disagree

true-gross-domestic-product-in-the-us.png
 
Not that I fully understand what you are saying but when you have a 1% prison population they really are an important part of the employment picture. On the other hand I believe about half of those incarcerated in the US actually are employed. They should be counted either way.

The reason prisoners, those in institutions, the military, and under 16 are not counted is because they all have legal barriers to gaining or leaving employment. Prisoners working or not working has nothing to do with the economy, just the penal system and how it is implemented. The military is similar...economic conditions have little to do with people entering or leaving the military, and you can't just quit. These, mental patients, and children who work would all distort the numbers.From 1984 to 1994, the military were included as part of the Labor Force and that UE rate was consitantly lower than the civilian rate. It just didn't show the right picture.

I hear you, but they really are a vital part of the employment profile of the nation.
 
The Clinton recession started in 1999 & we have never recovered. That was 2 years before Bush took office. We have only had inflation since 1999 but no economic growth.


Not according to the NBER and GDP stats

dsg230_500_350.jpg


Even the gold bugs disagree

true-gross-domestic-product-in-the-us.png


Obviously you do not understand the difference between Inflation & Economic Production.


What? "Real" GDP isn't inflation adjusted?

You posted a graph that measured the Dow's performance against gold as evidence of a recession's dateline and you wanna lecture me?

LMAO!!!! Rock on. The NBER is laughing at you.
 
Without data on the bullion banks and I know of no credible source for their actions or for that matter fake bullion (gold plated tungsten) LC's second graph is impossible to refute and it does show what you claim: that the recession began at the very start or just before Bush's first term. That being the case why aren't you noting that, saying thank you and moving on? Bush didn't have time to do squat in the first quarter of 2001 but find out how to navigate the White House and get his appointees through the Senate.
 
Last edited:
What? "Real" GDP isn't inflation adjusted?

You posted a graph that measured the Dow's performance against gold as evidence of a recession's dateline and you wanna lecture me?

LMAO!!!! Rock on. The NBER is laughing at you.

That fake assed inflation adjusted crap? They use the CPI to adjust for inflation. The CPI is a total lie since Clinton started that substitution crap.

You need to compare against something of a known quantity. Since Gold, Silver, Copper, & Oil don't seem to work for you. Try Iowa Farm Land. That is an exact known quantity. The amount of it never changed.

DuffyJan10figs3_4.gif


There was a real economic boom from 1981 until 1999. From that point we have been in an inflationary bust. Oil, Gold, Silver, Copper & Land prices prove that out.
 
Last edited:
nobody sensible is convinced by any economic data based on tracking stock prices -- commodity prices, even.
 
That fake assed inflation adjusted crap? They use the CPI to adjust for inflation. The CPI is a total lie since Clinton started that substitution crap.
Actually, hedonics were used for apparel and housing back in the 80's, and then it expanded in 1999. You're probably only hearing the misinformation and lies that the CPI substitutes hamburger for steak and only lowers inflation. Untrue...In many cases the adjustment shows higher inflation with hedonics. A simple Lespeyres index assumes no change in what people buy regardless of price changes and that overestimates actual spending. Hedonics looks at the relative change in prices for items in the same group (and hamburger is not in the same group as steak). For example, if premium ice cream goes up in price and regular ice cream doesn't, or not as much, people will tend to buy more regular ice cream, say 2 regular pints instead of 1 premium pint, and have the same level of consumer satisfaction. And the reverse is true..if regular ice cream goes up more than premium, people will switch to premium. The CPI is meant to emulate the cost of living at the same standard, and people do make substitutions based on relative price differences.
 
Oh man, you guys are sooo stuuuppiidd !!!

The CPI only showed 2.2% inflation from 2002 to 2008 when these basics of civilization & life tripled in price. Oil, Gas, Fertilizer, Land, Corn, Soybeans, Wheat, Hamburger, Houses, Electricity, Water, Trash, Sewer, Property Taxes, Copper, Silver, Steel, Concrete, Asphalt, Rubber, etc.

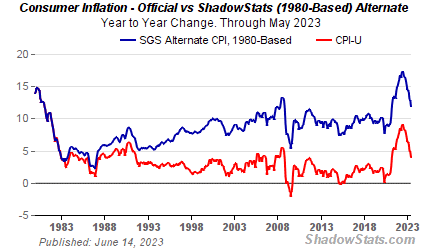
These price increases are what many say triggered the recession because people could no longer afford to pay their mortgages due to high gas & food prices. The sad reality you fools can't comprehend due to BLS lies is that inflation was above 10% during this time. The Shadowstats chart below does a better job of showing the inflation than the CPI. The big problem with both measurements is they do not show a strong enough deflation from 2008 to 2010. Land & commodity inflation over the past 100 years has been 3.5% & since 1970 it has been 8.5%.

sgs-cpi.gif
 
Last edited:
Land & commodity inflation over the past 100 years has been 3.5% & since 1970 it has been 8.5%.

sgs-cpi.gif

OK, so if commodity inflation has been 8.5% since 1970 that would mean commodity prices today would be 2600% of the price for the same commodity in 1970. Can you demonstrate one commodity for which this is true besides gold?
 
I just checked oil as an example and oil priced at $88/bbl today would indeed be 2600% the price of 3.39/bbl in 1970.

But the price between 1970 and 1976 quadrupled to $13.10/bbl. Meaning that the biggest chunk of the 8.5% inflation that you are referring to was simply a product of taking the dollar off the gold standard.

And that inflation measured with oil prices has only been 4.5% since 1976.
 
The CPI only showed 2.2% inflation from 2002 to 2008 when these basics of civilization & life tripled in price. Oil, Gas, Fertilizer, Land, Corn, Soybeans, Wheat, Hamburger, Houses, Electricity, Water, Trash, Sewer, Property Taxes, Copper, Silver, Steel, Concrete, Asphalt, Rubber, etc.
Jan 2002, the CPI was 177.7 (1982-84 = 100). Dec 2008 was 211.339. That's an increase of 18.9%. As for your list...land, property taxes, Copper, Silver, Steel, Concrete, Asphalt, and Rubber are not consumer goods, and so are not in the CPI...only indirectly as they effect final goods. Same thing if you're talking wholesale prices or futures for Corn, Soybeans, and Wheat.

These price increases are what many say triggered the recession because people could no longer afford to pay their mortgages due to high gas & food prices.
I understand that perfectly well.
The sad reality you fools can't comprehend due to BLS lies is that inflation was above 10% during this time. The Shadowstats chart below does a better job of showing the inflation than the CPI.
And yet nobody can duplicate Mr. Williams' results. BLS continued to use the old methodology to compare. BLS calculations has the change as a reduction of approx 0.3 percent/year, not the 10% or whatever Williams claims. No one has any clue where Williams got his numbers from.

Land & commodity inflation over the past 100 years has been 3.5% & since 1970 it has been 8.5%.
What part of "consumer" in Consumer Price Index is unclear to you?

Reading http://www.bls.gov/opub/mlr/2006/05/art2full.pdf analyzes the effects of the changes.

Addressing misconceptions
about the Consumer Price Index
Addresses the BS shadowstats puts out (though they don't mention him by name)
 
Last edited:
Land & commodity inflation over the past 100 years has been 3.5% & since 1970 it has been 8.5%.

sgs-cpi.gif

OK, so if commodity inflation has been 8.5% since 1970 that would mean commodity prices today would be 2600% of the price for the same commodity in 1970. Can you demonstrate one commodity for which this is true besides gold?

Yes !!!

- In 1970 Saudi Crude was $1.35 per Barrel. Now it is $83 & went as high as $147 per Barrel.
- In 1970 Platinum was $120 per oz. Today it is $1704 per oz.
- In 1970 Palladium was $35 per oz. Today it is $628 per oz.
- In 1970 Silver was $1.70 per oz. Today it is $24.20 per oz.
- In 1970 Iowa Farm Land Price was $419 per acre. Today it is over $7,500 per acre.

c2-70fig1.gif
 
Last edited:
KissMy, in 1970 oil was $3.39/bbl, by 1976 it had quadrupled in price. We went off the gold standard.

Historical Crude Oil Prices Table

and neither platinum, paladium, silver or Iowa farmland have increased in price 2500%.

Clearly inflation hasn't been 8.5% according to these examples, and may be as low as 4% since 1976 according to these examples.

Your own chart demonstrates that Iowa farmland has only increased in price at an annualized rate of 3% since 1980.

1970 Saudi Light Crude $1.35 per barrel - EIA Today is $83 per Barrel = 10.85% inflation

1970 Iowa farm land was $419 per acre. Today is $7,560 per acre = 7.5% inflation

1970 Silver was $1.70 per oz. Today is $24.29 per oz. = 7% inflation

1970 Gold was $35 per oz. Today is $1,343 per oz. = 9.55% inflation

1970 Palladium was $35 per oz. Today it is $628 per oz. = 7.5% inflation

1970 Potash Fertilizer was $37 per ton. Today it is over $1,000 per ton. = 8.6% inflation
 
Last edited:
and yet silver has only increased in price by about 15% since 1980 (Silver Prices - CurrentPrice and Historical Value), Chicago oil has only increased 1/3 as much as Saudi oil since 1970 (already linked), and gold has only increased by 60% since 1980 (Gold Price History).

those inflation rates are .6% for silver, .9% for gold and 4% for Chicago oil since 1976.

You are cherry picking, Kissmy. There was rampant inflation in the 70's and early 80's and since then it has been far less than what you are claiming.

All of which means that this diversion has jack shit to do with when the 2001 recession began.
 
Last edited:

Forum List

Back
Top