
SSDD
Gold Member
- Nov 6, 2012
- 16,672
- 1,966
- 280
So I was in a conversation with one of our local crop of warmers...one who claims to grasp the science and claims to have read the literature...including the IPCC documentation...... and rather than continue to swap insults, I decided that I might try asking a couple of questions about the greenhouse effect as described by climate science.
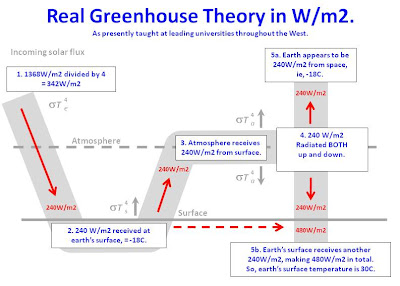
So I grab a diagram from the University of Washington atmospheric sciences department which they say describes the mechanism of the greenhouse effect. Here it is.

Our local warmer immediately begins to equivocate and then asks what's my point?
Well, I thought my point was pretty clear...I wanted to establish that we were on the same page to begin with...so I go out and get a few more diagrams from the atmospheric sciences department at Penn State, and Harvard, and one from no place in particular that seems to be showing the same thing. These are they.


Again, I ask if these describe the basic mechanism of the greenhouse effect as described by climate science. And what does the pathetic wretch ask me?...again...what's my point? This guy, who claims to get the science, and claims to have read the IPCC documentation can't bring himself to say whether or not the graphs above, purported by the University of Washington, Penn State, and Harvard to describe the mechanism of the greenhouse effect actually describes the mechanism of the greenhouse effect.
Who was the pathetic wretch I was talking to?....I am sure you can guess if you like...or you can go to the conversation here and see for yourself....
The fact that this warmer was scared....or unsure enough to even say whether or not the graphics above accurately show the mechanism of the greenhouse effect as described by climate science perhaps brings up a much larger point...but that's beside the point and doesn't begin to answer the questions I have about the greenhouse effect.
So are there any warmers here on the board that might be able to look at the graphics above and say whether or not they describe the basic mechanism of the greenhouse effect as described by climate science and perhaps talk a bit about that mechanism and effect? By the way...I notice some trivial differences in the above graphics that actually show the amount of radiation moving about...those differences are irrelevant to my questions...
So I grab a diagram from the University of Washington atmospheric sciences department which they say describes the mechanism of the greenhouse effect. Here it is.
Our local warmer immediately begins to equivocate and then asks what's my point?
Well, I thought my point was pretty clear...I wanted to establish that we were on the same page to begin with...so I go out and get a few more diagrams from the atmospheric sciences department at Penn State, and Harvard, and one from no place in particular that seems to be showing the same thing. These are they.
Again, I ask if these describe the basic mechanism of the greenhouse effect as described by climate science. And what does the pathetic wretch ask me?...again...what's my point? This guy, who claims to get the science, and claims to have read the IPCC documentation can't bring himself to say whether or not the graphs above, purported by the University of Washington, Penn State, and Harvard to describe the mechanism of the greenhouse effect actually describes the mechanism of the greenhouse effect.
Who was the pathetic wretch I was talking to?....I am sure you can guess if you like...or you can go to the conversation here and see for yourself....
The fact that this warmer was scared....or unsure enough to even say whether or not the graphics above accurately show the mechanism of the greenhouse effect as described by climate science perhaps brings up a much larger point...but that's beside the point and doesn't begin to answer the questions I have about the greenhouse effect.
So are there any warmers here on the board that might be able to look at the graphics above and say whether or not they describe the basic mechanism of the greenhouse effect as described by climate science and perhaps talk a bit about that mechanism and effect? By the way...I notice some trivial differences in the above graphics that actually show the amount of radiation moving about...those differences are irrelevant to my questions...


