OK... so why CO2 trails temperature?

Status
Not open for further replies.
I'm not as smart as you guys but manmade global warming still makes sense to me. After all there's that MIT slide I can still bring up where on 6 continents the natural+man-made graphs fit the temperature rise and the only natural ones all failed.
 
I'm not as smart as you guys but manmade global warming still makes sense to me. After all there's that MIT slide I can still bring up where on 6 continents the natural+man-made graphs fit the temperature rise and the only natural ones all failed.

I agree that a small amount of warming from man-made increase of CO2 makes sense.

The graphs from AR4 do not. Climate models built around a large climate sensitivity to CO2 don't work very well when you remove the CO2 input.

Climate models can't do the MWP or LIA. They are even worse for the rise out of the last ice age into the Holocene.

The large adjustments to pre-WWII ocean temperatures seemed to coincide with difficulties in back casting by climate models. Just sayin'
 
I assume AR4 are the graphs I pointed out and I don't know what MWP and LIA are. I have a Master's Degree in Math but it's useless here.
 
I assume AR4 are the graphs I pointed out and I don't know what MWP and LIA are. I have a Master's Degree in Math but it's useless here.

Google is your friend.

And a degree in math is helpful in sorting the wheat from the chaff in consensus climate science.
 
You keep grasping at straws.. The article I posted up show the energy at 100 Deg C is held in water vapor for upwards of 6-9 seconds. If we take this graphing out further, as it cools, the time gets real long in a normalized atmosphere pressure column.

Your link goes to this abstract-

.
Abstract
We study, using pump-probe optical methods with a time resolution of 1 ms, heat transfer when a series of water droplets impact a smooth surface whose temperature exceeds the boiling point. The volume of the individual water droplets is ≈10 nl, the time between droplets is ≈0.3 ms, and the number of water droplets in the series of droplets is 3, 20, or 100. In the temperature range 100 °C < T < 150 °C, our measurements of the heat transfer, and the residence time of water in contact with the surface, show that nearly all of the dispensed water vaporizes, but more rapidly, the higher the temperature. At higher temperatures, 150 °C < T < 220 °C, droplet shattering plays an increasingly important role in limiting heat transfer and, as a result, the volume of water evaporated and residence time decrease strongly with increasing temperature.

The water droplets vaporize quickly from 100C to 150C. Higher than 150C the water droplets are 'insulated' by explosive water vapour formation and the water droplet bounces.

This is the same way grandma tested the frying pan to see if it was hot enough to cook pancakes.

What the fuck does a 150+C flat smooth surface have to do with radiative atmospheric physics?
It is the way the energy is held and moved. Your missing the whole point. Your so fixated on CO2 you cant even see that the sliver of the bandwidth your so concerned about doesn't have the ability to do anything and in our atmosphere there are swamping factors that keep it from ever gaining that ability. If you do the LOG, of retention time, as the temperature deceases the length of time water can hold that energy increases.

Your so fixated on CO2 your totally missing the reasons it can not do anything.

I am fixated on how radiation input and output control whether the planetary system is warming or cooling, and also controls the amount energy stored in the atmosphere and surface, which in turn defines the temperature at all the locations along the pathways of solar energy in, and IR energy out.

You have not made any significant attempts to explain the meaning of your water drop on a hot skillet paper. You didn't even link the paper, just the abstract. Why didn't you at least pull out a quote from the paper to illustrate what you wanted to show?

I am sick and tired of trying to decipher your meaningless bafflegab. You may even have an interesting point, but I am not willing to wade through the bullshit to find it.

The meaning is simple. A flash to a changed state and then observing what happens after until it returns to that state.. AND YOU MISSED IT!

  • Water forced into a changed state.
  • Observe how the energy moves and how long it is held.
  • Make an assessment on how that would affect our atmosphere.
Then they assessed how long energy remains at much lower energy levels such as that of LWIR, how it is consumed and where the energy moves.

The Trenbreth Cartoon is so far from reality its laughable. You folks are so set on the "energy budget" that you miss how the energy actually moves. Your so fixated on CO2 that you wont even consider the other routes.


Link the paper, or at least quote the portion that supports your position.
I already gave it to you and you brushed it off as insignificant because it doesn't fit your belief in a CO2 driven atmosphere.
 
I assume AR4 are the graphs I pointed out and I don't know what MWP and LIA are. I have a Master's Degree in Math but it's useless here.
Global Temp REALITY.JPG


Above are the three predictive ranges of the IPCC and Hansen. As you can see they all failed miserably because they placed energy in our system (within their broken modeling programs) that does not exist.

Now that it is becoming clear that water vapor is a NEGATIVE factor and CO2 has near zero impact a lot of folks wont give up their religious beliefs and keep praying to the Al Gore church of the wayward and far out Global Warmers...

Now lets look at the best of the models..
cmip5-73-models-vs-obs-20n-20s-mt-5-yr-means11 Dr Roy Spencer.png


Modeling fails without exception and thus their understanding of our atmosphere function is shown lacking, severely.
 
Last edited:
Btw if the air temperature is below their 16 C average it gets even worse. You can check it with any off the shelf IR thermometer. You get effective sky temperatures of -25C and colder.
The internal ratios also change at the lower temperature. The change of about 35w/m^2 in both directions (atmosphere down absorbed and then emitted to space and surface to space) allows model runs to fall in line with current empirically observed trends. The model still misses the LIA and MEWP however... damn chaotic systems anyway!

70w/m^2 is the approximate energy that is being taken away by conduction and convection which current modeling fails to take into account. Residency time of the energy in water vapor is what throws the folks because they are not looking for it in the long waves of the H20 emissions band.
 
Last edited:
For 2.) What is the matter with you? I already replied to that !
Atm_Absorption.jpg

And what`s your point to ratio visible over IR ? That does not address how much down dwelling IR is absorbed.

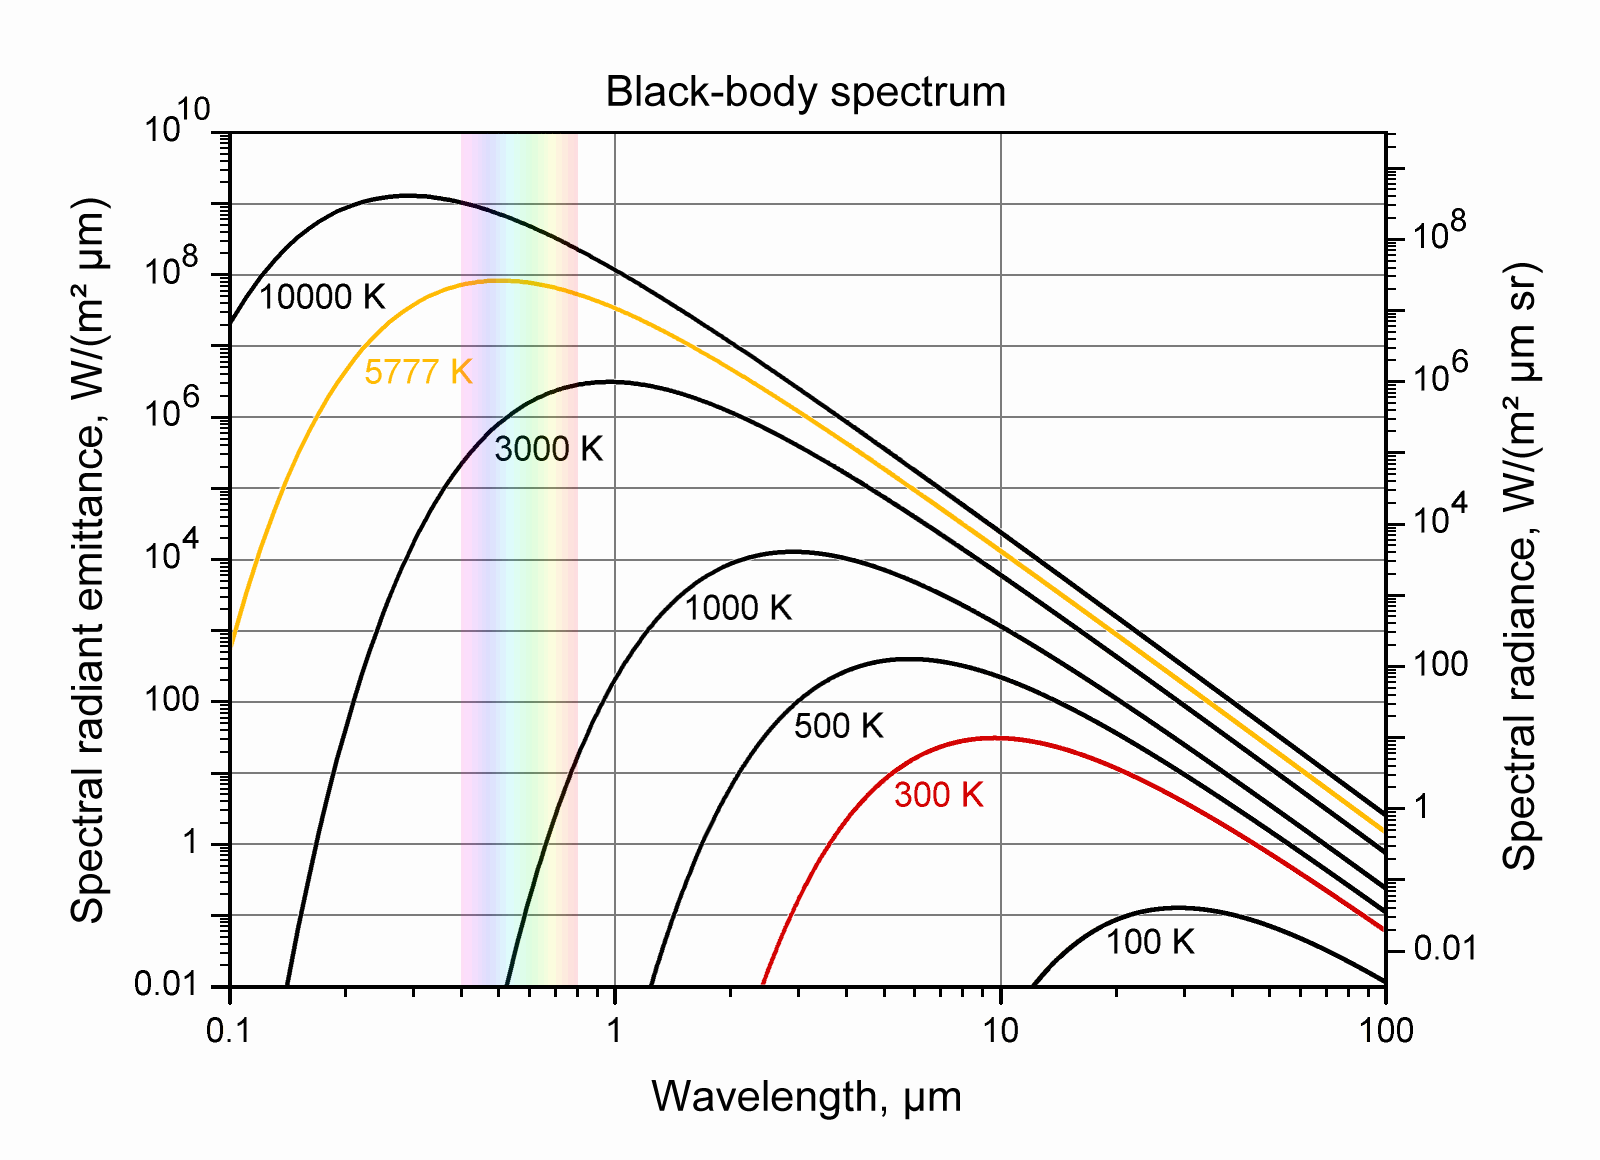
BlackbodySpectrum_loglog_150dpi_en.png

I took the liberty of posting a graph with log scales on both axis so that the amount of radiation is easily read for both wavelengths and amounts.

The Earth's surface radiates in the range of 2.5-100+ microns at 300K, =27C, =80F. For the convenience of using the lines, let's use 10 micron radiation instead of the 15 micron CO2 radiation that we are actually interested in.

At 300K there is about 30w of 10 micron radiation produced.

At 5777K (Sun) there is 10^4w produced (10,000w) of 10 micron radiation.

At 5777K the Sun produces 10^8w of 0.5 micron (green)radiation. 100,000,000 Watts! Good thing we are so far away.

By the time sunlight has reached the Earth it is only 1360w total, but it still has the same proportions. For every watt of green radiation there is only 1/10^4 of 10 micron IR. A pittance.


The graph you posted as a response to me has a range of 200nm to 2500nm. 0.2 microns to 2.5 microns. Basically it doesn't even overlap the range of Earth produced IR. At the same scale it would have to be 4 times wider to reach 10 microns, six times wider to reach 15 microns. Etc. The interesting part is that you coloured in by hand the gap at 1.4 microns. Were you confusing it with 14 microns? Assuming it was the 15 micron CO2 notch, perhaps?

The absorption of solar insolation by H2O, CO2, etc, is already accounted for. Any wavelengths shorter than 2.5 microns cannot be reemited by the atmosphere because it is far too cold. 30% of sunlight is reflected for no change, a third of what's left is absorbed by the atmosphere, the rest warm the surface. The 160w reaching the surface is not enough to support a 400w radiating surface. Even if you add the 80w of sunlight absorbed by the atmosphere you are 160w short. Where does that energy come from if not by surface radiation being absorbed by GHGs and recycled to the surface?

I don't want or expect exact numbers. But they do have to explain why the surface is warmer than the sunshine reaching it.

Are you up for it? I have asked the same question at least a hundred times, and none of the greenhouse effect deniers have replaced it with a coherent answer. Awe us with your brilliance.
Are you up for it? I have asked the same question at least a hundred times, and none of the greenhouse effect deniers have replaced it with a coherent answer.
I am supposed to answer more questions all at once than the poor gal at a WH press conference.
One at a time, because right now I also have to take care of my kids, + fix the electronic ignition system in my car etc etc. Let me start with how the 161 W incoming became 396 W on the ground.
All they did was adding 333 W "back radiation" to the 161, which brings them to 494 total on the ground.
Then they go on and say 17 W (=totally ridiculous see foot note #) is going up by convection (or thermals on the diagram) and 80W by evaporation (latent heat) . So it`s 494 -97= 397 W ( instead of 396 because only integers were used)
The short story is that`s how they got to 396 W total on the ground with only 161 W absorbed by the ground from incoming solar....Do you see now why the back radiation is their sacred cow?
And do you also see now why they downplay convection ?
Matter of fact they lied about convection in a big way.
#)In engineering it is a well known fact that a 1 kilowatt radiator radiates only 311 Watts and transmits the other 689 Watts by convection even in air that is still...no wind !
Heat Transfer Fundamentals: Radiant Vs Convection heat
wet-radiator-heat-output.jpg

I`ll answer the rest of your questions later when I get back from grocery shopping...gotta go my ride is here else if my car were running I`l stay and humor you right now
Essentially a 2.2/1 ratio..

SO they omit that which changes everything by pretending it doesn't exist.

:clap2::clap2::clap2:

Thank You for affirming the basic physics they want to make go away.. Now what in our atmosphere is capable of completing this task?
 
Let me start with how the 161 W incoming became 396 W on the ground.
All they did was adding 333 W "back radiation" to the 161, which brings them to 494 total on the ground.
Then they go on and say 17 W (=totally ridiculous see foot note #) is going up by convection (or thermals on the diagram) and 80W by evaporation (latent heat) . So it`s 494 -97= 397 W ( instead of 396 because only integers were used)
The short story is that`s how they got to 396 W total on the ground with only 161 W absorbed by the ground from incoming solar.
The 396 W is not a back calculation from other variables. It comes directly from the Stefan Boltzmann law. It's the fact that the average earth temperature is 16C that requires the earth to radiate 396 W/m².

To see this go to a SB calculator,
Stefan Boltzmann Law Calculator - Omni
Enter 1 for area to get the radiation per square meter.
Enter 16 for the temperature. The overall emissivity of the earth is close to 1. You will see the answer is 396 W/m².
That would be nice but the earth is not at a static 16 deg C. So the calculations are but a statisticians wet dream.

That's the problem with a good majority of the issues which cause the modeling to fail. They make assumptions which do not bear out reality.
 
Don't worry about me... I'm just not smart enough and yes I did try to google those things.

It seems at the moment that man-made global warming is not true, but I really am not worth convincing.
 
I remember in Graduate School some Professors were arguing and they didn't trust the double hockey sticks... they thought global warming wasn't man-made.
 
Hahahaha.

SSDD, Billyboob and Polarbear don't realize the ramifications of what they are saying. They don't follow through to the obvious consequences.

We know how much solar radiation reaches the surface, by measurement. We know how warm the surface is, and therefore how much it emit, again by measurement. There is a huge differential. Trenberth's cartoon puts it as 161-396 for a deficit of -235. That must be accounted for. I don't care what the exact numbers are, it is a huge amount that cannot be just measurement error, and the error is just as likely to make it larger than smaller.

Trenberth also has 100w of energy leaving the surface by convection and latent heat. Oh oh! The deficit just got larger! I am willing to accept entropy as the motivator that moves the energy but the energy must be there in the first place. Now the deficit is -235 plus -98 = -333

We know by measurement how much solar energy reaches the Earth, how much is reflected, how much gets to the surface, and infer how much is absorbed by the atmosphere. 340 minus 100 reflected minus 160 surface absorbed minus 80 atmosphere absorbed equals zero. All accounted for.

We know by measurement how much radiation leaves the Earth. 100 solar shortwave and 240 terrestrial infrared. Again all accounted for. Input equals output. But where does the infrared come from? Some from the surface, some from the atmosphere.

That just leaves the local surface deficit to be accounted for. The 333w deficit must be coming back from the atmosphere. There is no other available source. How does it get back? A combination of radiation and conduction.

If the three amigos are right and more energy is being moved into the atmosphere by convection and latent heat, what does that change? It simply makes the deficit larger and the returning energy larger. We are at equilibrium. Total input and output are equal, the system is in stasis. The amounts of energy going through the various pathways are tuned by Nature to provide the maximum heat loss.

Many factors can affect the equilibrium, some known and some unknown, but the surface temperature has remained the same for billions of years, give or take a handful of degrees. Absolutely amazing considering the huge changes that have happened.

The recent change of CO2 concentration is adding a warming influence of 1C per doubling, it is simple physics. Less radiation can escape through its bands, that energy is stored in the atmosphere and returns to the surface. But it is only one small factor and is very likely to be compensated for by other factors. The climate is not a boulder perched on a mountain top waiting to roll down. It is a boulder sitting in a valley with steep sides that can't be pushed very far up the hill.
 
Don't worry about me... I'm just not smart enough and yes I did try to google those things.

It seems at the moment that man-made global warming is not true, but I really am not worth convincing.

AR4 is the fourth assessment report of the IPCC, the origin of your graph. You didn't look very hard. The MWP is the Medieval Warm Period, I will let you work out the LIA for yourself.
 
Hahahaha.

SSDD, Billyboob and Polarbear don't realize the ramifications of what they are saying. They don't follow through to the obvious consequences.

We know how much solar radiation reaches the surface, by measurement. We know how warm the surface is, and therefore how much it emit, again by measurement. There is a huge differential. Trenberth's cartoon puts it as 161-396 for a deficit of -235. That must be accounted for. I don't care what the exact numbers are, it is a huge amount that cannot be just measurement error, and the error is just as likely to make it larger than smaller.

Trenberth also has 100w of energy leaving the surface by convection and latent heat. Oh oh! The deficit just got larger! I am willing to accept entropy as the motivator that moves the energy but the energy must be there in the first place. Now the deficit is -235 plus -98 = -333

We know by measurement how much solar energy reaches the Earth, how much is reflected, how much gets to the surface, and infer how much is absorbed by the atmosphere. 340 minus 100 reflected minus 160 surface absorbed minus 80 atmosphere absorbed equals zero. All accounted for.

We know by measurement how much radiation leaves the Earth. 100 solar shortwave and 240 terrestrial infrared. Again all accounted for. Input equals output. But where does the infrared come from? Some from the surface, some from the atmosphere.

That just leaves the local surface deficit to be accounted for. The 333w deficit must be coming back from the atmosphere. There is no other available source. How does it get back? A combination of radiation and conduction.

If the three amigos are right and more energy is being moved into the atmosphere by convection and latent heat, what does that change? It simply makes the deficit larger and the returning energy larger. We are at equilibrium. Total input and output are equal, the system is in stasis. The amounts of energy going through the various pathways are tuned by Nature to provide the maximum heat loss.

Many factors can affect the equilibrium, some known and some unknown, but the surface temperature has remained the same for billions of years, give or take a handful of degrees. Absolutely amazing considering the huge changes that have happened.

The recent change of CO2 concentration is adding a warming influence of 1C per doubling, it is simple physics. Less radiation can escape through its bands, that energy is stored in the atmosphere and returns to the surface. But it is only one small factor and is very likely to be compensated for by other factors. The climate is not a boulder perched on a mountain top waiting to roll down. It is a boulder sitting in a valley with steep sides that can't be pushed very far up the hill.
You keep asking me the same question over and over again. I just told you how they got to these numbers in my last post...and now I am asking you:
Every time that back radiation comes up you warmers claim whatever the CO2 absorbs it must re-emit. 1/2 goes up and the other 1/2 back down.
So please do tell the rest of us how come that "global energy flow" cartoon has it at 333 W down and only 239 up? That is 1 1/2 times as much going down instead of just 1/2...(= 166.5 W)
And the most blatant falsification is never questioned by any of you melt-down freaks which is the fact air convection out-paces radiation by a factor of of ~ 2.2 times
While the diagram handed down by the doomsday prophets has it only at ~ 0.25 times...(356 W radiating up + 40 through the "window")
Holy f-ck it that was true your face would fry faster than the hot dog on a stick above the fire.
That Wuwei or whatever handle he is using lately claims that the 396 watts calculated from the 16C is not a back calculation. It sure as F-ck is not a measurement.
For that you would have to IR scan the entire planet 24/7 365 days for 20 years and be able to tell the difference between reflected IR, ground emission and what came from the air above it...
I already stated earlier that they simply used the 16C average in the St.B to calculate that number...and here he is "telling" me "it is not a back calculation"
First you claim that its "next to nothing" how much heat (W/m^2) the GHGs prevent from heating the ground and then demand I explain why their diagram only has it at 160 W getting to the ground. Wtf can`t you read?...:
All they did was adding 333 W "back radiation" to the 161, which brings them to 494 total on the ground.Then they go on and say 17 W (=totally ridiculous see foot note #) is going up by convection (or thermals on the diagram) and 80W by evaporation (latent heat) . So it`s 494 -97= 397 W ( instead of 396 because only integers were used)
The short story is that`s how they got to 396 W total on the ground with only 161 W absorbed by the ground from incoming solar...


I have better things to do that sit here and respond to idiots like that
 
Last edited:
That Wuwei or whatever handle he is using lately claims that the 396 watts calculated from the 16C is not a back calculation. It sure as F-ck is not a measurement.
For that you would have to IR scan the entire planet 24/7 365 days for 20 years and be able to tell the difference between reflected IR, ground emission and what came from the air above it...
I already stated earlier that they simply used the 16C average in the St.B to calculate that number...and here he is "telling" me "it is not a back calculation"
I don't know what your problem is. But, to clarify, the 396 W/m² is not calculated from any atmospheric parameters. That's what I mean by it's not a back calculation. That number is a calculation. Period. You don't have to bring in anything like convection into that calculation. Simply put, anything that's warm must radiate. The SB equation tells you how much.
 
You keep asking me the same question over and over again. I just told you how they got to these numbers in my last post...and now I am asking you:
Every time that back radiation comes up you warmers claim whatever the CO2 absorbs it must re-emit. 1/2 goes up and the other 1/2 back down.
So please do tell the rest of us how come that "global energy flow" cartoon has it at 333 W down and only 239 up? That is 1 1/2 times as much going down instead of just 1/2...(= 166.5 W)

The amount of radiation escaping to space is controlled by the height/temperature at which it is finally emitted.

A molecule that becomes excited and is given enough time to drop down to groundstate will emit a photon in a random direction. We are most interested in the up and down components, therefore, given the limitations of graphing a 3D action on to 2D paper, we ignore the side-to-side and back-to-front components.

You are conflating the direction of radiation with the escape of radiation. They are not the same thing.


Now, will you explain why you think the amount of IR emitted from the Sun in the terrestrial range of 2-100 microns makes any significant difference?

I have shown that it is roughly 1/10,000th of the amount of visible light. The solar flux is 1360w divided by 4 (for the spherical shape and rotation). The IR is less than 340/10,000w. One thirtieth of a watt. Why do you think it is important?

I doubt that you will answer. You just run away when you are asked inconvenient questions.
 
I'm not as smart as you guys but manmade global warming still makes sense to me. After all there's that MIT slide I can still bring up where on 6 continents the natural+man-made graphs fit the temperature rise and the only natural ones all failed.
I agree that a small amount of warming from man-made increase of CO2 makes sense.

The graphs from AR4 do not. Climate models built around a large climate sensitivity to CO2 don't work very well when you remove the CO2 input.

Climate models can't do the MWP or LIA. They are even worse for the rise out of the last ice age into the Holocene.

The large adjustments to pre-WWII ocean temperatures seemed to coincide with difficulties in back casting by climate models. Just sayin'
I assume AR4 are the graphs I pointed out and I don't know what MWP and LIA are. I have a Master's Degree in Math but it's useless here.
View attachment 181673

Above are the three predictive ranges of the IPCC and Hansen. As you can see they all failed miserably because they placed energy in our system (within their broken modeling programs) that does not exist.

Now that it is becoming clear that water vapor is a NEGATIVE factor and CO2 has near zero impact a lot of folks wont give up their religious beliefs and keep praying to the Al Gore church of the wayward and far out Global Warmers...

Now lets look at the best of the models..
View attachment 181683

Modeling fails without exception and thus their understanding of our atmosphere function is shown lacking, severely.
OK I get what you guys are saying now. LIA little ice age. I think AGW is still winning, but like I said don't mind me.
 
Status
Not open for further replies.

Forum List

Back
Top