OK... so why CO2 trails temperature?

Status
Not open for further replies.
I don't know how to get you to see this... Your so set on AGW that you refuse to see what empirical observations are telling us right in front of our eyes.

He won't see it for the same reason the heads of science of the time wouldn't see that the earth revolves around the sun...it challenges the dogma and he is driven by dogma. Rather than thinking about how the dogma is wrong...he expends his intellectual wattage trying to get everything to fit within the dogma...just the way it has always been...history tells us that eventually a paradigm shift will happen and the dogma is replaced with something that closer resembles the truth...till such time as it becomes dogma as well.
 
Thank you for your help. I have been waffling as of late.
The next time you waffle all you need to do is ask yourself how the earth entered and left a glacial cycle with CO2 levels at or above 7,000ppm..

View attachment 179620

And when we get to a resolution where you can see them.....

View attachment 179621

This pattern is right in line with Milankovitch cycles and lays waste to any credible CO2 fantasy.

in other words, none of the actual climate scientists agree with it

And you think that matters? Look back through the history of science...everything that is accepted science (accepted through observation and measurement that is...not merely models as is the case with climate science) was at an earlier point contrary to what the "actual" scientists of the time believed...everything.

But if you like, feel free to point out a hypothesis which sprung forward complete and remained unchanged through the entire scientific process of moving forward from hypothesis...to theory....to law.

History tells us damned near all the time that if you are on board with the consensus in the early stages of a field of science, then you are probably wrong.
 
Thank you for your help. I have been waffling as of late.
The next time you waffle all you need to do is ask yourself how the earth entered and left a glacial cycle with CO2 levels at or above 7,000ppm..

View attachment 179620

And when we get to a resolution where you can see them.....

View attachment 179621

This pattern is right in line with Milankovitch cycles and lays waste to any credible CO2 fantasy.

in other words, none of the actual climate scientists agree with it
Poor silly jilly....

all you have left is personal attack... priceless...

When people make comments like that, they are just showing that not only do they NOT grasp the scientific method, and can't identify whether it is being followed or not, but they show you that they are ignorant of history as well...how may times has history tried to teach the lesson that if you are on board with the scientific consensus, then you are probably wrong?
 
You keep grasping at straws.. The article I posted up show the energy at 100 Deg C is held in water vapor for upwards of 6-9 seconds. If we take this graphing out further, as it cools, the time gets real long in a normalized atmosphere pressure column.

Your link goes to this abstract-

.
Abstract
We study, using pump-probe optical methods with a time resolution of 1 ms, heat transfer when a series of water droplets impact a smooth surface whose temperature exceeds the boiling point. The volume of the individual water droplets is ≈10 nl, the time between droplets is ≈0.3 ms, and the number of water droplets in the series of droplets is 3, 20, or 100. In the temperature range 100 °C < T < 150 °C, our measurements of the heat transfer, and the residence time of water in contact with the surface, show that nearly all of the dispensed water vaporizes, but more rapidly, the higher the temperature. At higher temperatures, 150 °C < T < 220 °C, droplet shattering plays an increasingly important role in limiting heat transfer and, as a result, the volume of water evaporated and residence time decrease strongly with increasing temperature.

The water droplets vaporize quickly from 100C to 150C. Higher than 150C the water droplets are 'insulated' by explosive water vapour formation and the water droplet bounces.

This is the same way grandma tested the frying pan to see if it was hot enough to cook pancakes.

What the fuck does a 150+C flat smooth surface have to do with radiative atmospheric physics?[/QUOTE]
 
You really don't use your brain for much other than learning the dogma do you? Ever notice how broad the H20 spectrum is...water is getting rid of most of the energy that makes it to the upper atmosphere...along with some CO2 that is up there and a few other so called greenhouse gasses...sometimes you come up with the stupidest ideas...

And it isn't CO2 energy..it is just energy...

curve_s.gif


There is the shape of radiation leaving the Earth and escaping to space. The red line is the amount of radiation leaving the surface.

For wavenumbers 800-1000 (roughly 10-13 microns), the radiation escapes freely with almost no interaction with the atmosphere. That is the maximum and most efficient way of losing energy by radiation.

You say water vapour is releasing almost all of the GHG absorbed energy. So where is it? Point out the wavenumber or wavelength band where you think it is coming out.

I see reduced output at every band that reacts with a GHG, without exception.

Are we being ''fooled by instrumentation" again? What experiments and data would you prefer to use? The brochure from a salesman selling radiant heat panels?
 
Thank you for your help. I have been waffling as of late.
The next time you waffle all you need to do is ask yourself how the earth entered and left a glacial cycle with CO2 levels at or above 7,000ppm..

View attachment 179620

And when we get to a resolution where you can see them.....

View attachment 179621

This pattern is right in line with Milankovitch cycles and lays waste to any credible CO2 fantasy.

in other words, none of the actual climate scientists agree with it
Poor silly jilly....

all you have left is personal attack... priceless...

When people make comments like that, they are just showing that not only do they NOT grasp the scientific method, and can't identify whether it is being followed or not, but they show you that they are ignorant of history as well...how may times has history tried to teach the lesson that if you are on board with the scientific consensus, then you are probably wrong?

Sorry, I don't pander to lying rabid loons. The climate scientists believe one thing. I'm not going to debate with a moron who wants to pretend that his lying idiots know something the climate scientists don't.

and science is sometimes shown to be wrong. but not by imbeciles who aren't using scientific method. the SCIENE is the best information we have available now. not what the loony hacks make up in their heads.

I hope that helps you

and if you want to play with a moron like the one you just responded to, that's pretty much your problem. not mine.

nice guitar in your avi though.
 
The water cycle that moves energy into the atmosphere does make a huge difference.

If it was not there the surface would be much hotter and the atmosphere would be much cooler.
 
curve_s.gif


All of the white area under the red line is radiation that is absorbed by GHGs and cannot find a way out.

If SSDD's explanation was correct then some bands would have to be greater than surface Blackbody radiation to make up for the missing radiation absorbed and stored in the atmosphere.

In a way that is almost correct. Energy from the atmosphere returns to the surface, adding to the 240w of solar insolation, allowing the surface to achieve a temperature that radiates at almost 400w.

You can't increase the radiation in specific bands but you can increase all the radiation in the whole range by increasing the temperature of the surface.
 
You keep grasping at straws.. The article I posted up show the energy at 100 Deg C is held in water vapor for upwards of 6-9 seconds. If we take this graphing out further, as it cools, the time gets real long in a normalized atmosphere pressure column.

Your link goes to this abstract-

.
Abstract
We study, using pump-probe optical methods with a time resolution of 1 ms, heat transfer when a series of water droplets impact a smooth surface whose temperature exceeds the boiling point. The volume of the individual water droplets is ≈10 nl, the time between droplets is ≈0.3 ms, and the number of water droplets in the series of droplets is 3, 20, or 100. In the temperature range 100 °C < T < 150 °C, our measurements of the heat transfer, and the residence time of water in contact with the surface, show that nearly all of the dispensed water vaporizes, but more rapidly, the higher the temperature. At higher temperatures, 150 °C < T < 220 °C, droplet shattering plays an increasingly important role in limiting heat transfer and, as a result, the volume of water evaporated and residence time decrease strongly with increasing temperature.

The water droplets vaporize quickly from 100C to 150C. Higher than 150C the water droplets are 'insulated' by explosive water vapour formation and the water droplet bounces.

This is the same way grandma tested the frying pan to see if it was hot enough to cook pancakes.

What the fuck does a 150+C flat smooth surface have to do with radiative atmospheric physics?
[/QUOTE]
It is the way the energy is held and moved. Your missing the whole point. Your so fixated on CO2 you cant even see that the sliver of the bandwidth your so concerned about doesn't have the ability to do anything and in our atmosphere there are swamping factors that keep it from ever gaining that ability. If you do the LOG, of retention time, as the temperature deceases the length of time water can hold that energy increases.

Your so fixated on CO2 your totally missing the reasons it can not do anything.
 
You keep grasping at straws.. The article I posted up show the energy at 100 Deg C is held in water vapor for upwards of 6-9 seconds. If we take this graphing out further, as it cools, the time gets real long in a normalized atmosphere pressure column.

Your link goes to this abstract-

.
Abstract
We study, using pump-probe optical methods with a time resolution of 1 ms, heat transfer when a series of water droplets impact a smooth surface whose temperature exceeds the boiling point. The volume of the individual water droplets is ≈10 nl, the time between droplets is ≈0.3 ms, and the number of water droplets in the series of droplets is 3, 20, or 100. In the temperature range 100 °C < T < 150 °C, our measurements of the heat transfer, and the residence time of water in contact with the surface, show that nearly all of the dispensed water vaporizes, but more rapidly, the higher the temperature. At higher temperatures, 150 °C < T < 220 °C, droplet shattering plays an increasingly important role in limiting heat transfer and, as a result, the volume of water evaporated and residence time decrease strongly with increasing temperature.

The water droplets vaporize quickly from 100C to 150C. Higher than 150C the water droplets are 'insulated' by explosive water vapour formation and the water droplet bounces.

This is the same way grandma tested the frying pan to see if it was hot enough to cook pancakes.

What the fuck does a 150+C flat smooth surface have to do with radiative atmospheric physics?
It is the way the energy is held and moved. Your missing the whole point. Your so fixated on CO2 you cant even see that the sliver of the bandwidth your so concerned about doesn't have the ability to do anything and in our atmosphere there are swamping factors that keep it from ever gaining that ability. If you do the LOG, of retention time, as the temperature deceases the length of time water can hold that energy increases.

Your so fixated on CO2 your totally missing the reasons it can not do anything.

I am fixated on how radiation input and output control whether the planetary system is warming or cooling, and also controls the amount energy stored in the atmosphere and surface, which in turn defines the temperature at all the locations along the pathways of solar energy in, and IR energy out.

You have not made any significant attempts to explain the meaning of your water drop on a hot skillet paper. You didn't even link the paper, just the abstract. Why didn't you at least pull out a quote from the paper to illustrate what you wanted to show?

I am sick and tired of trying to decipher your meaningless bafflegab. You may even have an interesting point, but I am not willing to wade through the bullshit to find it.
 
Figure1.png


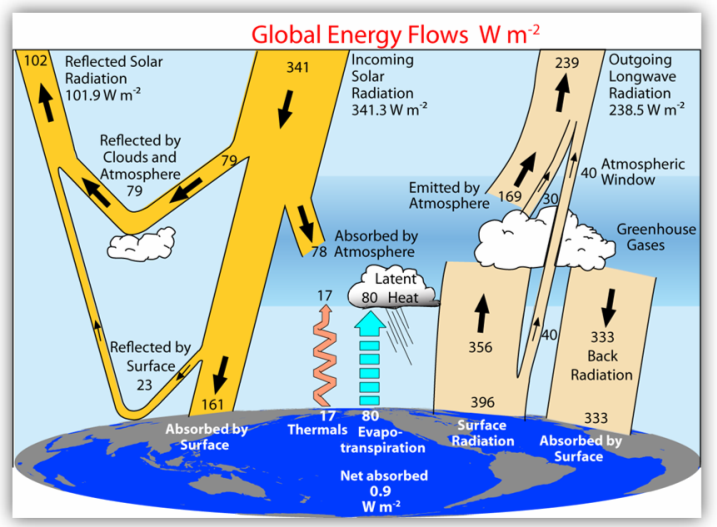
Trenberth's cartoon.

I wouldn't bet the farm on the numbers being exactly right, and I am somewhat uncomfortable calling all of the 333w returning to the surface as radiation, but overall I am reasonably satisfied that this graph is in the ballpark.

We know the average surface temperature so we know how much it radiates (bogus adjustments only change it by 5 or 10w at most)

We know the TOA solar input, and how much is reflected. We know how much reaches the surface so we also know how much is absorbed by the atmosphere.

The main mystery that I see is the radiation coming from the cloudtops through the Atmospheric Window. I don't know how much is supposed to be emitted by a surface temp of 396w. If it is only 40w as depicted then something is seriously wrong. If it is about 70w then the graph is misleading because it shows the cloudtops radiating almost as much as the surface.

The most interesting case is if 70w is the amount for surface radiation PLUS the (17+80)w for convection and phase change turned into radiation by ice and water in the clouds.
 
Why would any sane person even consider this "average everything" idiotic "energy budget"
First off none of the proponents ever got the "global average" temperature right....because they simply can`t and cheat on top of that. Second they also assume an average effective sky temperature to get to their 333 w/m^2 "back radiation". To get that is not even in the realm of what is possible with the methods they have been using.
So they simply fiddled with the number till they get one that does not knock down their closed CO2 radiation window to corroborate the temperature increases they want to forecast.
If you use some actual effective sky temperature vs. air temperature measurements you can see how often it is wrong:
effective_Sky_T.jpg

The green line is for their +16C "average" global temperature and the red one for the effective sky temperature for 333 w/m^2. The only time their assumption works is for temperatures way above 16 C
 
You keep grasping at straws.. The article I posted up show the energy at 100 Deg C is held in water vapor for upwards of 6-9 seconds. If we take this graphing out further, as it cools, the time gets real long in a normalized atmosphere pressure column.

Your link goes to this abstract-

.
Abstract
We study, using pump-probe optical methods with a time resolution of 1 ms, heat transfer when a series of water droplets impact a smooth surface whose temperature exceeds the boiling point. The volume of the individual water droplets is ≈10 nl, the time between droplets is ≈0.3 ms, and the number of water droplets in the series of droplets is 3, 20, or 100. In the temperature range 100 °C < T < 150 °C, our measurements of the heat transfer, and the residence time of water in contact with the surface, show that nearly all of the dispensed water vaporizes, but more rapidly, the higher the temperature. At higher temperatures, 150 °C < T < 220 °C, droplet shattering plays an increasingly important role in limiting heat transfer and, as a result, the volume of water evaporated and residence time decrease strongly with increasing temperature.

The water droplets vaporize quickly from 100C to 150C. Higher than 150C the water droplets are 'insulated' by explosive water vapour formation and the water droplet bounces.

This is the same way grandma tested the frying pan to see if it was hot enough to cook pancakes.

What the fuck does a 150+C flat smooth surface have to do with radiative atmospheric physics?
It is the way the energy is held and moved. Your missing the whole point. Your so fixated on CO2 you cant even see that the sliver of the bandwidth your so concerned about doesn't have the ability to do anything and in our atmosphere there are swamping factors that keep it from ever gaining that ability. If you do the LOG, of retention time, as the temperature deceases the length of time water can hold that energy increases.

Your so fixated on CO2 your totally missing the reasons it can not do anything.

I am fixated on how radiation input and output control whether the planetary system is warming or cooling, and also controls the amount energy stored in the atmosphere and surface, which in turn defines the temperature at all the locations along the pathways of solar energy in, and IR energy out.

You have not made any significant attempts to explain the meaning of your water drop on a hot skillet paper. You didn't even link the paper, just the abstract. Why didn't you at least pull out a quote from the paper to illustrate what you wanted to show?

I am sick and tired of trying to decipher your meaningless bafflegab. You may even have an interesting point, but I am not willing to wade through the bullshit to find it.

The meaning is simple. A flash to a changed state and then observing what happens after until it returns to that state.. AND YOU MISSED IT!

  • Water forced into a changed state.
  • Observe how the energy moves and how long it is held.
  • Make an assessment on how that would affect our atmosphere.
Then they assessed how long energy remains at much lower energy levels such as that of LWIR, how it is consumed and where the energy moves.

The Trenbreth Cartoon is so far from reality its laughable. You folks are so set on the "energy budget" that you miss how the energy actually moves. Your so fixated on CO2 that you wont even consider the other routes.


Link the paper, or at least quote the portion that supports your position.
 
Why would any sane person even consider this "average everything" idiotic "energy budget"
First off none of the proponents ever got the "global average" temperature right....because they simply can`t and cheat on top of that. Second they also assume an average effective sky temperature to get to their 333 w/m^2 "back radiation". To get that is not even in the realm of what is possible with the methods they have been using.
So they simply fiddled with the number till they get one that does not knock down their closed CO2 radiation window to corroborate the temperature increases they want to forecast.
If you use some actual effective sky temperature vs. air temperature measurements you can see how often it is wrong:
effective_Sky_T.jpg

The green line is for their +16C "average" global temperature and the red one for the effective sky temperature for 333 w/m^2. The only time their assumption works is for temperatures way above 16 C

You're getting to be as bad as Billyboob. State your point, link your graph (no result from Google)

Explain how the surface supports a radiating temperature of nearly 400 w from solar insolation of only 160w (240 if you include what is absorbed by the atmosphere)

And why have you not responded to my point about your earlier graph? It showed four orders of magnitude (edit- 10,000 times) more visible light being produced by the Sun compared to solar IR. How much of that solar IR do you think reaches the Earth system?
*)You're getting to be as bad as Billyboob. State your point, link your graph (no result from Google)

1.)Explain how the surface supports a radiating temperature of nearly 400 w from solar insolation of only 160w (240 if you include what is absorbed by the atmosphere)

2.)And why have you not responded to my point about your earlier graph? It showed four orders of magnitude (edit- 10,000 times) more visible light being produced by the Sun compared to solar IR.
3.)How much of that solar IR do you think reaches the Earth sy
stem?
For 2.) What is the matter with you? I already replied to that !
Atm_Absorption.jpg

And what`s your point to ratio visible over IR ? That does not address how much down dwelling IR is absorbed.
Do you have a problem looking at a graph and understanding what it expresses?
If you want that as a number all you have to do is to integrate what is under the blue line in the CO2 bands and ratio it with the areas I marked in green...Oh I forgot I am supposed to do that for you because you either can`t be bothered or don`t know how.
and in 1.) at the same time you state that out of 400 w down dwelling only 160 w make it through the atmosphere. ...and expect me to come up with an answer that you won`t even bother to think through anyways.
The answer is simple. They got the 160 watts by using the 16 C average and StB converted it into watts.
No measurement whatsoever...as usual !
and to *)
No surprise that you can`t find it with Google. Are you insinuating I made up that graph like the bastards who peddle all this phony GW data do?
You can download this pdf and find the graph on page 3
https://www.researchgate.net/profile/Naouel_Daouas/post/How_to_find_effective_sky_temperature_knowing_only_ambient_air_temperature_and_the_solar_irradiance/attachment/59d61ddb79197b807797b09c/AS:273728288559106@1442273317322/download/sky+temperature+modelisation.pdf
 
Last edited:
Btw if the air temperature is below their 16 C average it gets even worse. You can check it with any off the shelf IR thermometer. You get effective sky temperatures of -25C and colder.
 
For 2.) What is the matter with you? I already replied to that !
Atm_Absorption.jpg

And what`s your point to ratio visible over IR ? That does not address how much down dwelling IR is absorbed.

BlackbodySpectrum_loglog_150dpi_en.png

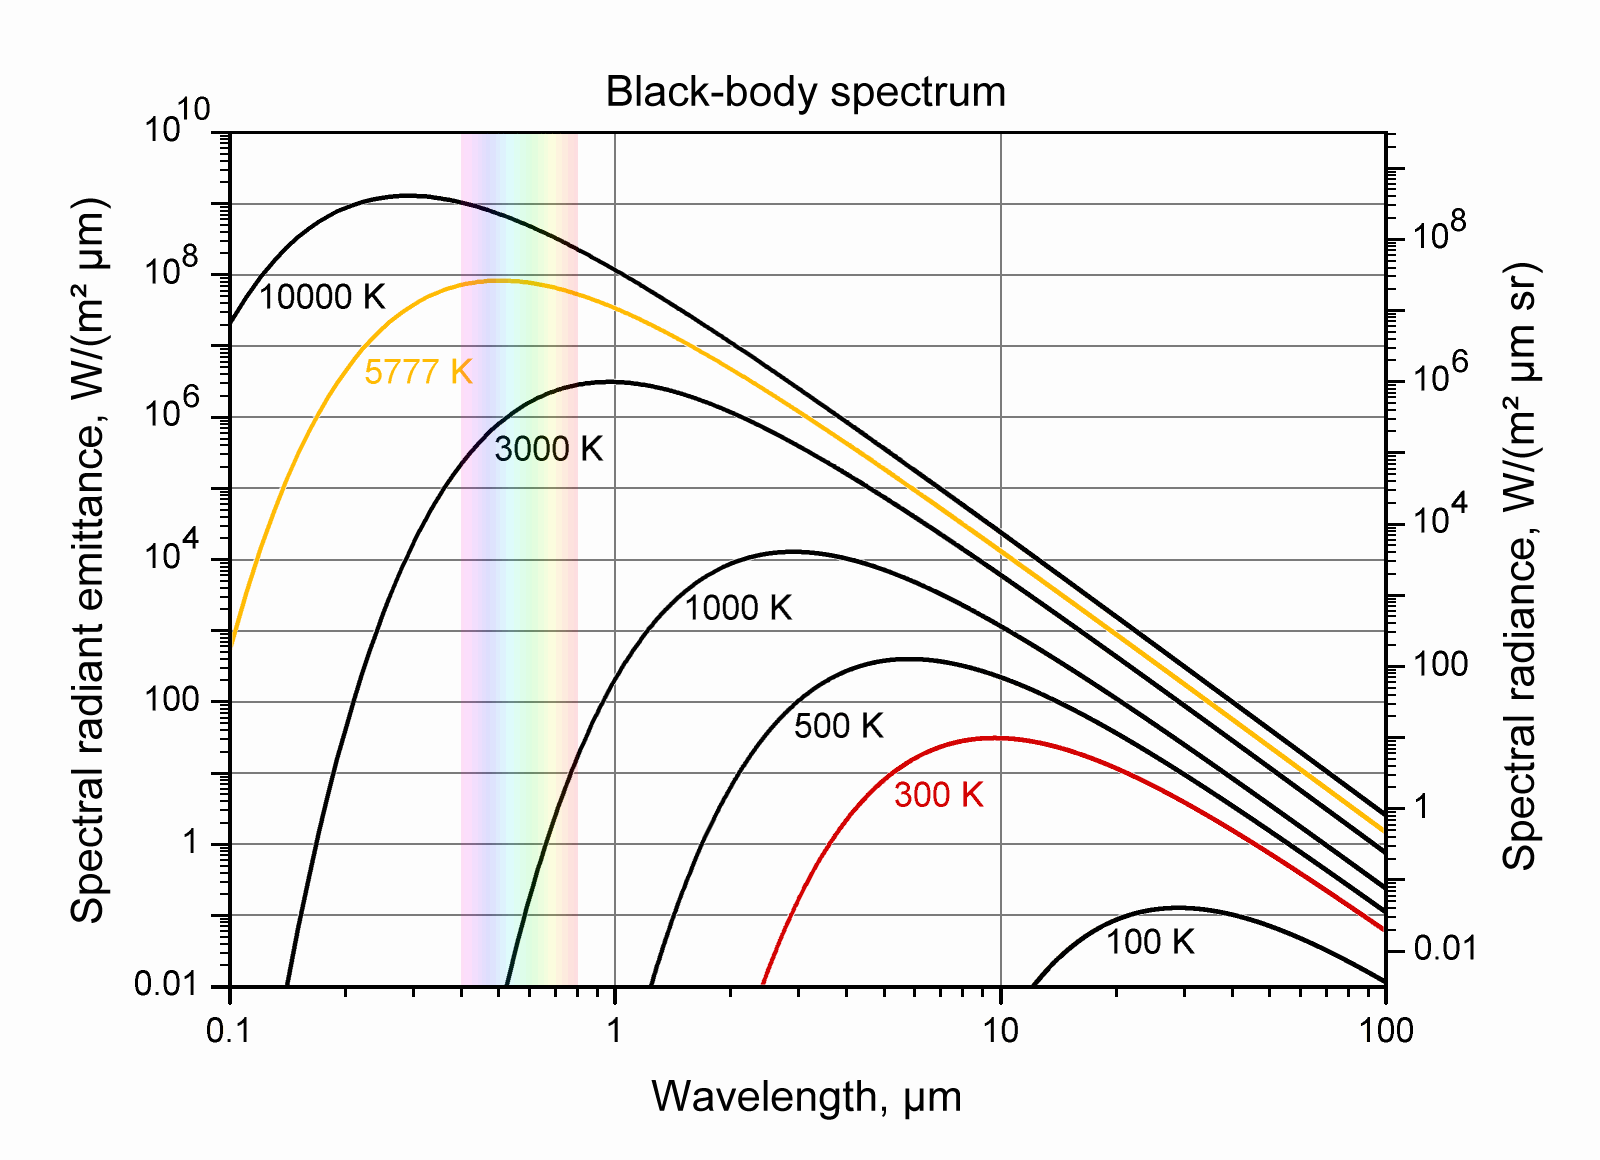
I took the liberty of posting a graph with log scales on both axis so that the amount of radiation is easily read for both wavelengths and amounts.

The Earth's surface radiates in the range of 2.5-100+ microns at 300K, =27C, =80F. For the convenience of using the lines, let's use 10 micron radiation instead of the 15 micron CO2 radiation that we are actually interested in.

At 300K there is about 30w of 10 micron radiation produced.

At 5777K (Sun) there is 10^4w produced (10,000w) of 10 micron radiation.

At 5777K the Sun produces 10^8w of 0.5 micron (green)radiation. 100,000,000 Watts! Good thing we are so far away.

By the time sunlight has reached the Earth it is only 1360w total, but it still has the same proportions. For every watt of green radiation there is only 1/10^4 of 10 micron IR. A pittance.


The graph you posted as a response to me has a range of 200nm to 2500nm. 0.2 microns to 2.5 microns. Basically it doesn't even overlap the range of Earth produced IR. At the same scale it would have to be 4 times wider to reach 10 microns, six times wider to reach 15 microns. Etc. The interesting part is that you coloured in by hand the gap at 1.4 microns. Were you confusing it with 14 microns? Assuming it was the 15 micron CO2 notch, perhaps?

The absorption of solar insolation by H2O, CO2, etc, is already accounted for. Any wavelengths shorter than 2.5 microns cannot be reemited by the atmosphere because it is far too cold. 30% of sunlight is reflected for no change, a third of what's left is absorbed by the atmosphere, the rest warm the surface. The 160w reaching the surface is not enough to support a 400w radiating surface. Even if you add the 80w of sunlight absorbed by the atmosphere you are 160w short. Where does that energy come from if not by surface radiation being absorbed by GHGs and recycled to the surface?

I don't want or expect exact numbers. But they do have to explain why the surface is warmer than the sunshine reaching it.

Are you up for it? I have asked the same question at least a hundred times, and none of the greenhouse effect deniers have replaced it with a coherent answer. Awe us with your brilliance.
 
Status
Not open for further replies.

Forum List

Back
Top