June ice the lowest on record

It's getting there. Are you suggesting that, since it hasn't happened yet, it can't possibly be happening? I haven't died yet, but I'm reasonably certain it will happen. Your logic implies that, as long as I'm alive, I can reasonably believe I'll live forever. See what conundrums you get into when you're totally fixated on the politics of the controversy to the exclusion of the science and logic?!?!

If we're losing gigatons of ice every nanosecond, shouldn't there be a real measurable rise, not some statistical chart showing a probable rise, in the sea levels?

Please cite the source that says we're losing gigatons every nanosecond.

OK, the nanosecond is my own addition just to show how absurd the notion of Massive ice loss is!

If the ice is melting, where is it going?

If it's going into the sea, why aren't the Maldives underwater?
 
You guys do a lot of those little "additons". That's a major reason why your analysis isn't to be trusted. Science is an exacting field. Throwing stuff out like that marks you as someone who has only a passing acquaintance with the subject.
 
You guys do a lot of those little "additons". That's a major reason why your analysis isn't to be trusted. Science is an exacting field. Throwing stuff out like that marks you as someone who has only a passing acquaintance with the subject.

It's called stretching things to the absurd.

A friend of mine used to write comedy for Phyllis Diller, Johnny Carson and Rodney Dangerfield and he used to sit by a pool in Hollywood or Las Vegas with a yellow pad amd pencil and take some current event and apply a few different twists to it to make it funny, this was one of his techniques.

THE QUESTION REMAINS: IF THE ICE IS MELTING, WHERE IS IT GOING?

Into the sea of course. The fact that it isn't going fast enough for you, is evidence of nothing. Thanks for the insight in how you come up with your ludicrous claims!
 
The rate of sea level rise has increased from less than 1 mm per year in 1880 to over 3.7 mm per year at present. And that rate is accelerating.

Climate Change: The current rate of CO2 rise is unprecedented in the recent history of the Earth

With the exception of rapid atmospheric changes triggered by major volcanic events, asteroid impacts and methane release, which led to the great mass extinction of species [1], the current rate of CO2 rise (2005-08: 1.66-2.55 ppm/year) is unprecedented in the recent history of the Earth, driving polar ice melt and sea level rise rates in excess of IPCC projections. Warming of large parts of the Arctic and Antarctic circles by 3-4oC during 1975-2009 (~0.09–0.12 degrees C/year) triggers fast feedback effects from ice melt, albedo loss and open water infrared absorption, and from the carbon cycle. Estimates of future sea level rise derived from 40 years records (1.6-3.7 mm/year), glacier flow rates and ice shelf collapse dynamics, and yet little-quantified positive feedbacks, render exponential to non-linear sea level rise on the scale of tens of meters over the next few centuries possible. The rise in the oceans heat content (1950-2004: 16.10^22 Joules), lowered pH (8.2 - 8.1), and enhancement of the CO3(-2) to HCO3(-) transition, threatens algae, calcifying plankton and reef habitats from shallow habitats to abyssal depths [2]. The best outcomes of the looming Copenhagen climate summit, 25 percent carbon emission reduction relative to 1990 levels, would be unable to arrest the rise of mean global temperatures over 2 degrees Celsius relative to pre-industrial levels. The rise in CO2 emissions by 41% since 1990 [3] and continuing land clearing go counter to the urgently required measures at mitigation, massive reforestation, revegetation, application of biochar and chemical draw-down of atmospheric CO2. While governments vie to vested interests and economists calculate the price of the Earth, a denial syndrome underpinned by an ideology of human mastery over nature is enhanced by a massive disinformation campaign by contrarians who ignore the basic laws of physics and chemistry and falsify climate data.

Of all the physical and chemical indicators of climate change the rate of sea level rise is the most sensitive parameter, reflecting both thermal expansion of upper layers of the oceans and ice sheet collapse rates. The rise of sea level rates from below 1 mm/year about 1880, to about over 3.7 mm/year by 2008 (Figures 1, 2) [4-8] constitutes the definitive warning for H. “Sapiens”. In Greenland mass ice loss increased from 137 billion ton (GtI) ice/year in 2002–2003 to 286 GtI/year in 2007–2009 [6]. In Antarctica ice mass loss increased from 104 GtI/year in 2002–2006 to 246 GtI/year in 2006–2009 [6]. According to Kerr (2009) “the latest analysis of the most comprehensive, essentially continuous, monitoring of the ice sheets shows that the losses have not eased in the past few years.” [7, 8].Recent reports highlight major underestimates by IPCC reports on which most economic and government assessments since 2001, including the Stern and Garnaut reports, have been based [9-12]. Economic models attempt correlations between target atmospheric CO2 stabilization levels (cf. 450, 550, 650 ppm) ([10] Fig SPM-6) and economic costs of mitigation. For example, for a range of emission scenarios, stabilization of CO2 at 450 ppm by 2050 was purported to cost 3-4% of GDP, while stabilization at 750 ppm was supposed to cost less than 1% GDP by 2050 ([10] Fig. SPM-9).

Seriously?

"...the current rate of CO2 rise (2005-08: 1.66-2.55 ppm/year) is unprecedented in the recent history of the Earth, driving polar ice melt and sea level rise rates in excess of IPCC projections. Warming of large parts of the Arctic and Antarctic circles by 3-4oC during 1975-2009"

So why do you refuse to show how this happens in a laboratory setting?
 
Last edited:
You guys do a lot of those little "additons". That's a major reason why your analysis isn't to be trusted. Science is an exacting field. Throwing stuff out like that marks you as someone who has only a passing acquaintance with the subject.

It's called stretching things to the absurd.
It's called lying your ass off because you can do nothing else.
 
It's getting there. Are you suggesting that, since it hasn't happened yet, it can't possibly be happening? I haven't died yet, but I'm reasonably certain it will happen. Your logic implies that, as long as I'm alive, I can reasonably believe I'll live forever. See what conundrums you get into when you're totally fixated on the politics of the controversy to the exclusion of the science and logic?!?!


It's allways getting there. Isn't it. But it never gets there. We've been waiting and waiting and waiting and waiting and......
 
You guys do a lot of those little "additons". That's a major reason why your analysis isn't to be trusted. Science is an exacting field. Throwing stuff out like that marks you as someone who has only a passing acquaintance with the subject.

It's called stretching things to the absurd.
It's called lying your ass off because you can do nothing else.

Except to keep challenging you Warmers to show us in a laboratory setting how adding rate 100 PPM (your articles said "(2005-08: 1.66-2.55 ppm/year)" so I'm being generous will cause a "Warming of large parts of the Arctic and Antarctic circles by 3-4oC during 1975-2009"

Can you show us that just once?

Why is that like asking for you to show us a leprechaun riding a unicorn while battling an elf?
 
It's getting there. Are you suggesting that, since it hasn't happened yet, it can't possibly be happening? I haven't died yet, but I'm reasonably certain it will happen. Your logic implies that, as long as I'm alive, I can reasonably believe I'll live forever. See what conundrums you get into when you're totally fixated on the politics of the controversy to the exclusion of the science and logic?!?!
It's allways getting there. Isn't it. But it never gets there. We've been waiting and waiting and waiting and waiting and......

the_end_is_near.jpg
 
It's getting there. Are you suggesting that, since it hasn't happened yet, it can't possibly be happening? I haven't died yet, but I'm reasonably certain it will happen. Your logic implies that, as long as I'm alive, I can reasonably believe I'll live forever. See what conundrums you get into when you're totally fixated on the politics of the controversy to the exclusion of the science and logic?!?!

Better to be dying to live than living to die.

Since your taking the long term view, how are the ice age plans coming?
 
You haven't a leg to stand on. Science can not even begin to replica the claim that CO2 is causing the problem and that man made the CO2. You keep claiming vast amounts of ice have vanished and yet no one would know it by the sea levels.

You know that the world wide network for measuring temperature has been systemically removing non city sources while adding more city sources.

You are a liar and a moron. And you want us to believe that a 31 year record of an earth activity is somehow important to the discussion.

Remind us how tree rings prove temperatures on the left coast but similar methods used to prove a hot period in the middle ages were faulty.
 
You guys do a lot of those little "additons". That's a major reason why your analysis isn't to be trusted. Science is an exacting field. Throwing stuff out like that marks you as someone who has only a passing acquaintance with the subject.


:rofl::rofl::rofl::rofl::rofl::rofl:

Then why the hell do you allow the AGW crowd to play with the numbers? You are a laugh riot!
 
Put on hold, as the forcing of AGW are far greater than the forcing of the Milankovic Cycles.


If that is so why isn't there widespread and incontrovertible evidence of warming? If what you say is true then we should have allready risen to the temperature levels that were last seen in the MWP.

You sir are hoist on your own petard.
 
You haven't a leg to stand on. Science can not even begin to replica the claim that CO2 is causing the problem and that man made the CO2. You keep claiming vast amounts of ice have vanished and yet no one would know it by the sea levels.

You know that the world wide network for measuring temperature has been systemically removing non city sources while adding more city sources.

You are a liar and a moron. And you want us to believe that a 31 year record of an earth activity is somehow important to the discussion.

Remind us how tree rings prove temperatures on the left coast but similar methods used to prove a hot period in the middle ages were faulty.

And you, Sarge, are a senile fool.

The Carbon Dioxide Greenhouse Effect

Tree-Ring Data - World Data Center for Paleoclimatology

http://web.utk.edu/~grissino/itrdb.htm

Chaco Digital Initiative
 
Keep dodging the objectively quantifiable and verifiable facts, and I'll keep posting this.

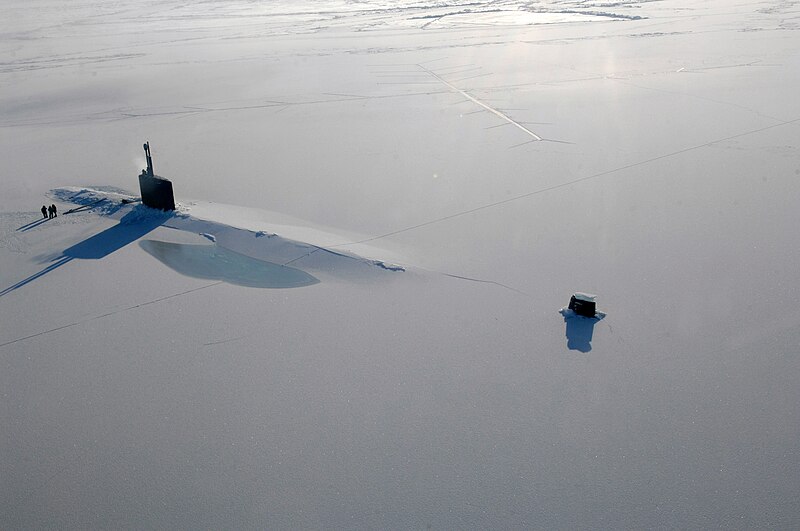
The Navy requires accurate sea ice information for their operations, and has spent a lot of effort over the years studying, measuring, and operating in Arctic ice both above and below, such as they did in the ICEX 2009 exercise.

800px-USS_Annapolis_ICEX.jpg

The US Navy attack submarine USS Annapolis (SSN 760) rests in the Arctic Ocean after surfacing through three feet of ice during Ice Exercise 2009 on March 21, 2009. The two-week training exercise, which is used to test submarine operability and war-fighting capability in Arctic conditions, also involved the USS Helena (SSN 725), the University of Washington and personnel from the Navy Arctic Submarine Laboratory.

So, if you are planning on bringing a $900 million Los Angeles class submarine through the ice, as the captain might say to the analyst after receiving an ice report: “you’d better be damn sure of the ice thickness before I risk the boat and the crew”.

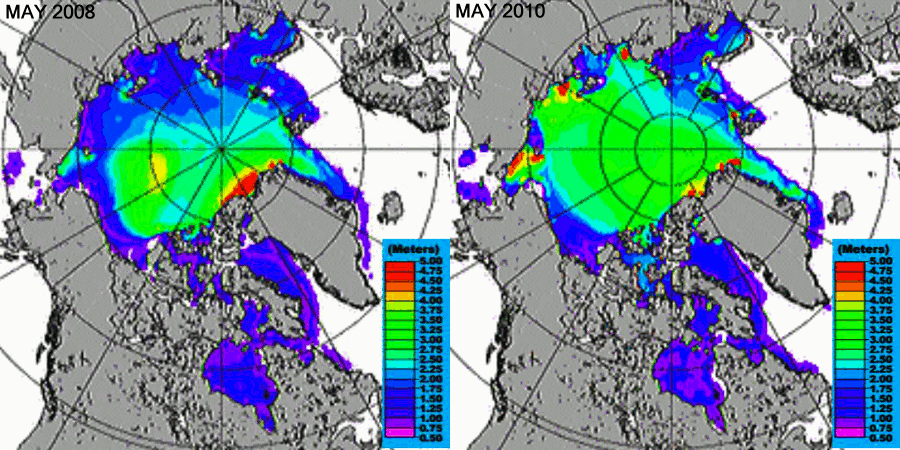
Below is a blink comparator of U.S. Navy PIPS sea ice forecast data, zoomed to show the primary Arctic ice zone.

pips_anim.gif

Arctic Ice Volume Has Increased 25% Since May, 2008 | Watts Up With That?
 
Put on hold, as the forcing of AGW are far greater than the forcing of the Milankovic Cycles.


If that is so why isn't there widespread and incontrovertible evidence of warming? If what you say is true then we should have allready risen to the temperature levels that were last seen in the MWP.

You sir are hoist on your own petard.

What a fucking idiot you prove yourself to be everytime you post. Even the denialists like Limpbaugh finally had to admit that there is widespread proof that it is warming. He just denies that we have anything to do with it.

As for you, you do not know from day to day what you think. Come on, Faux Geologist, have you never heard of glaciers or ice caps?
 
Really, Dooodeee......... You really think that the ice has more extent and is thicker than it has been in the past? Odd that these scientists do not agree with you, and have pictures, on a daily basis, to back up what they say.

Arctic Sea Ice News & Analysis

July 6, 2010
Rapid ice loss continues through June
Average June ice extent was the lowest in the satellite data record, from 1979 to 2010. Arctic air temperatures were higher than normal, and Arctic sea ice continued to decline at a fast pace. June saw the return of the Arctic dipole anomaly, an atmospheric pressure pattern that contributed to the record sea ice loss in 2007.
 

Forum List

Back
Top