
edthecynic
Censored for Cynicism
- Oct 20, 2008
- 43,044
- 6,883
- 1,830
Oh Baloney, just saying.Again we see how CON$ deliberately deceive by telling just enough truth and then shutting up. What you left out was the "intense peer review" was NEGATIVE!!!
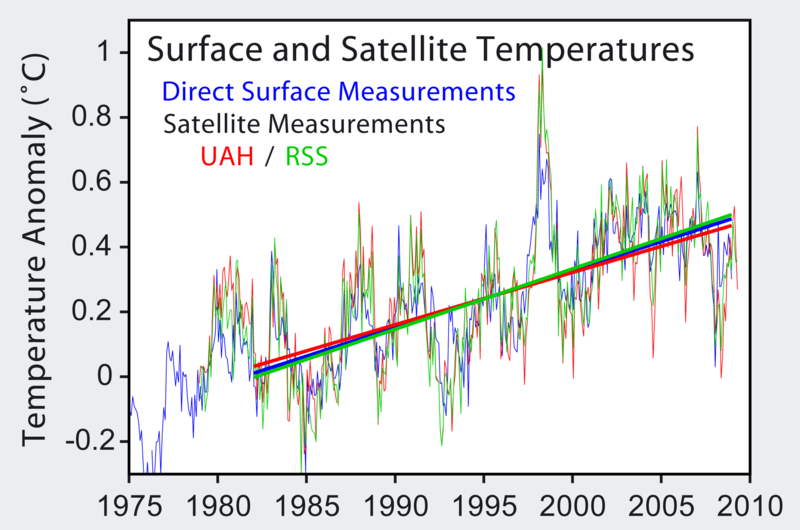
A perfect example of why is the lie highlighted in blue. The land based temp trend (blue line) splits the two satellite trends (red and green lines) right down the middle.
Of course, you again dishonestly blow off the fact that the peer review was negative and precisely because it was NOT a scientific study, in fact, the coordinator of the "study" is an economist!!!Noting Ed's post and that he blew off a peer reviewed scientific report in favor of posting more computer manufactured graphs most likely from propagandists.
And thanking you, IanC, for keeping it reasonable.
Nobody with a brain thinks this stuff should not be studied. Nobody with a brain thinks that climate research should not be done or that whatever results are honestly produced should not be widely reported. An open mind is essential.
But anybody with a brain has to know that data produced by those whose funding depends on the data should be verified and verified and verified again before that data should be trusted as the last word.
And anybody with a brain has to know that there are politics and opportunistic motives built into all this stuff that simply cannot be blown off or dismissed as irrelevant.
By all means lets continue the research and if, and only IF, the data re AGW is confirmed by credible scientists who don't have a dog in the fight, THEN we should figure out what is the best way to deal with that. And IF the data shows that we are into a major climate shift, THEN we should figure out how to best help people adjust to that.
Otherwise, I am not willing to hand over my personal liberties, opportunities, choices, options, etc. for national or international policy that would control all of those based on what is most probably faulty or even junk science. And I am not willing to consign whole populations to more generations of crushing poverty based on what is most probably faulty or junk science either.
"Anyone with a brain" knows that the red line in the graph comes from the most famous deniers Christy and Spencer at the UAH.
Again, CON$ refuse to believe any data that goes against their religious dogma no matter who the source.
Ed- why are you using the new hockey stick graph? What happened to the old one that didn't show the MWP and the Little Ice Age? And you say all the lines are independent analysis but you don't really have a clue as to the data involved in making them or the overlap of data or the preferential weighting of specific data sets.
That is the point the canadian economist was making. All we see is the graph and the methodologies are hidden away. Why are some tree rings used and heavily weighted while others are discounted or ignored?
Jus sayin...
All the data and methodology is readily available.

Reconstructions
The reconstructions used, in order from oldest to most recent publication are:
(dark blue 1000-1991):
[abstract] [DOI] Jones, P.D., K.R. Briffa, T.P. Barnett, and S.F.B. Tett (1998). "High-resolution Palaeoclimatic Records for the last Millennium: Interpretation, Integration and Comparison with General Circulation Model Control-run Temperatures". The Holocene 8: 455-471.
(blue 1000-1980):
[abstract] [full text] Mann, M.E., R.S. Bradley, and M.K. Hughes (1999). "Northern Hemisphere Temperatures During the Past Millennium: Inferences, Uncertainties, and Limitations". Geophysical Research Letters 26 (6): 759-762.
(light blue 1000-1965):
[abstract] Crowley, Thomas J. and Thomas S. Lowery (2000). "Northern Hemisphere Temperature Reconstruction". Ambio 29: 51-54. ; Modified as published in [abstract] [DOI] Crowley (2000). "Causes of Climate Change Over the Past 1000 Years". Science 289: 270-277.
(lightest blue 1402-1960):
[abstract] [DOI] Briffa, K.R., T.J. Osborn, F.H. Schweingruber, I.C. Harris, P.D. Jones, S.G. Shiyatov, and E.A. Vaganov (2001). "Low-frequency temperature variations from a northern tree-ring density network". J. Geophys. Res. 106: 2929-2941.
(light green 831-1992):
[abstract] [DOI] Esper, J., E.R. Cook, and F.H. Schweingruber (2002). "Low-Frequency Signals in Long Tree-Ring Chronologies for Reconstructing Past Temperature Variability". Science 295 (5563): 2250-2253.
(yellow 200-1980):
[abstract] [full text] [DOI] Mann, M.E. and P.D. Jones (2003). "Global Surface Temperatures over the Past Two Millennia". Geophysical Research Letters 30 (15): 1820.
(orange 200-1995):
[abstract] [full text] [DOI] Jones, P.D. and M.E. Mann (2004). "Climate Over Past Millennia". Reviews of Geophysics 42: RG2002.
(red-orange 1500-1980):
[abstract] [DOI] Huang, S. (2004). "Merging Information from Different Resources for New Insights into Climate Change in the Past and Future". Geophys. Res Lett. 31: L13205.
(red 1-1979):
[abstract] [full text] [DOI] Moberg, A., D.M. Sonechkin, K. Holmgren, N.M. Datsenko and W. Karlén (2005). "Highly variable Northern Hemisphere temperatures reconstructed from low- and high-resolution proxy data". Nature 443: 613-617.
(dark red 1600-1990):
[abstract] [DOI] Oerlemans, J.H. (2005). "Extracting a Climate Signal from 169 Glacier Records". Science 308: 675-677.
(black 1856-2004): Instrumental data was jointly compiled by the Climatic Research Unit and the UK Meteorological Office Hadley Centre.


")
