Here’s a story that should be the lead across the nation:

Sorry to bust up this party with facts.. But we REALLY REALLY should get a grip and look at some data...

So you declare a rapid increase arctic temperatures is proof AGW theory is wrong, even though such a rapid increase never happened before, and even though AGW theory specifically predicted the rapid increase in arctic temperatures well ahead of time? Even for you, that's dumb.

As can be seen from this thread, a common factor among denialists is that, without exception, they all suck in epic fashion at basic logical thinking. One factor that breeds denialists is a near-total inability to think logically.

The other factor is a disregard for honesty. Again, as you can see from this thread, denialists are almost always right-wing political cultists (the opposite of AGW scientists, who come from all political persuasions, and who don't spend their days going off on crazy political rants). Naturally, denialists will deny the purely political basis of their beliefs. In the moral relativist denialist mind, lying is morally justifiable, so long as those lies aid them their quest to hate the people on their enemies list.
 
Last edited:
Sorry to bust up this party with facts.. But we REALLY REALLY should get a grip and look at some data...

So you declare a rapid increase arctic temperatures is proof AGW theory is wrong, even though such a rapid increase never happened before, and even though AGW theory specifically predicted the rapid increase in arctic temperatures well ahead of time? Even for you, that's dumb.

As can be seen from this thread, a common factor among denialists is that, without exception, they all suck in epic fashion at basic logical thinking. One factor that breeds denialists is a near-total inability to think logically.

The other factor is a disregard for honestly. Again, as you can see from this thread, denialists are almost always right-wing political cultists (the opposite of AGW scientists, who come from all political persuasions, and who don't spend their days going off on crazy political rants). Naturally, denialists will deny the purely political basis of their beliefs. In the moral relativist denialist mind, lying is morally justifiable, so long as those lies aid them their quest to hate the people on their enemies list.

How do you know it has never happened before... Earth has been here much longer than scientists have been recording changing climate.
 
Sorry to bust up this party with facts.. But we REALLY REALLY should get a grip and look at some data...

So you declare a rapid increase arctic temperatures is proof AGW theory is wrong, even though such a rapid increase never happened before, and even though AGW theory specifically predicted the rapid increase in arctic temperatures well ahead of time? Even for you, that's dumb.

As can be seen from this thread, a common factor among denialists is that, without exception, they all suck in epic fashion at basic logical thinking. One factor that breeds denialists is a near-total inability to think logically.

The other factor is a disregard for honesty. Again, as you can see from this thread, denialists are almost always right-wing political cultists (the opposite of AGW scientists, who come from all political persuasions, and who don't spend their days going off on crazy political rants). Naturally, denialists will deny the purely political basis of their beliefs. In the moral relativist denialist mind, lying is morally justifiable, so long as those lies aid them their quest to hate the people on their enemies list.

You claim to be a technical person, but you're really NOT impressing me following the data in that graph.. Let's look again.........

arctic_temp_trends_rt.gif


Note that this is NOT the GISS or HCN data. THis is the ARCTIC temperature record. There's a SIGNIFICANT DIFF. And the fact that for the ice to melt -- it needs to exceed a THRESHOLD so that rates of warming have LESS to do with SIExtent than absolute temps and the DURATION of those absolute temps..

So in the graph we see a RATE of warming in the 30s that meets or EXCEEDS the current rate and compares with peak temps we are experiencing. THUS -- the ice melt should be similiar. Except that the rise in the 30s continued for a very long time. As long or longer than the current period above the melt threshold..

As for your Karmac assertions about the models predicting all this.. Impossible... And that's the point. Those intervening decades of REBUILDING ICE would never have been picked up by today's pre-ordained AGW models..

Also note that the 65yr trend line WAS NEGATIVE. Something that would NEVER come out of a model based on the faulty theory of CO2 forcing..

Take your rant about stereotyping denialists and skeptics and shove it back into your own deep orifice of denial...... It doesn't belong in a rational discussion..
 
Last edited:
Sorry to bust up this party with facts.. But we REALLY REALLY should get a grip and look at some data...

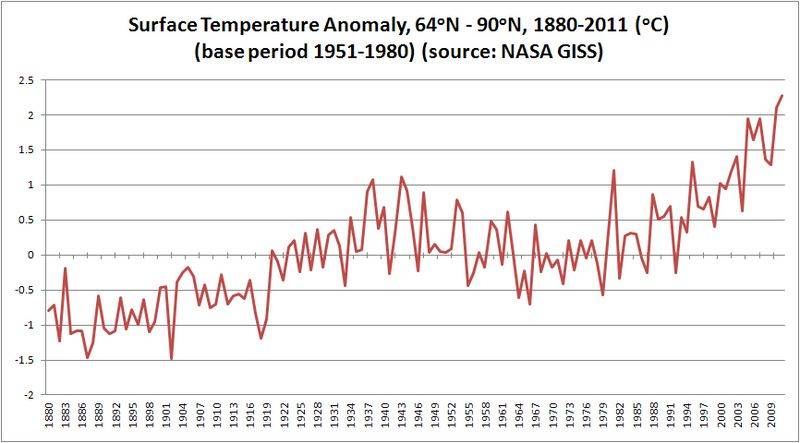
(for those who can't navigate a link --- It's NASA.GOV..)

arctic_temp_trends_rt.gif


Ice melts when the temp increases.. There were no pretty real-time satellite pixs in the 1930s, but i imagine if there WERE --- we wouldn't all be listening to panty wetting going on NOW about the melt.
ALL ANECTODAL and historical records indicate the melt in the mid 30s and 40s was substantially the same if not more severe than the recent trend..


If you stare at the graph and the trendlines for a minute or 2 --- you'll learn a bit about panicking about climate over a couple decades of observation.. Might help the incontinience problem we're seeing...

mann_treering.jpg


"My tree rings say you're wrong!" -- M Mann (Note: the tree rings don't actually say that but once you hide the decline and alter the remaining data the peer reviewed consensus indicates that these rings, especially the one I'm hiding under my fingers, will cause a hockey stick like chart configuration)
 
Sorry to bust up this party with facts.. But we REALLY REALLY should get a grip and look at some data...

So you declare a rapid increase arctic temperatures is proof AGW theory is wrong, even though such a rapid increase never happened before, and even though AGW theory specifically predicted the rapid increase in arctic temperatures well ahead of time? Even for you, that's dumb.

As can be seen from this thread, a common factor among denialists is that, without exception, they all suck in epic fashion at basic logical thinking. One factor that breeds denialists is a near-total inability to think logically.

The other factor is a disregard for honestly. Again, as you can see from this thread, denialists are almost always right-wing political cultists (the opposite of AGW scientists, who come from all political persuasions, and who don't spend their days going off on crazy political rants). Naturally, denialists will deny the purely political basis of their beliefs. In the moral relativist denialist mind, lying is morally justifiable, so long as those lies aid them their quest to hate the people on their enemies list.

How do you know it has never happened before... Earth has been here much longer than scientists have been recording changing climate.

Quite simply --- he's wrong. Because he's mistaking the Arctic Temp graph for what he's heard about the GLOBAL surface averages. The earth has more than ONE CLIMATE. And tho the warmers know this --- they ignore this fact in MOST of the models that make front page news. "The rapid increase" in the 1930s for the Arctic MEETS or EXCEEDS the current warming trend in that region.
 
Arctic Tipping Point: A North Pole Without Ice by Fen Montaigne: Yale Environment 360

Even more striking is the precipitous decline in the volume of ice in the Arctic Ocean. An analysis conducted by the University of Washington’s Pan Arctic Ice Ocean Model Assimilation System (PIOMAS) estimates that sea ice volumes fell in late August to roughly 3,500 cubic kilometers — a 72-percent drop from the 1979-2010 mean.

Peter Wadhams, who heads the Polar Ocean Physics Group at the University of Cambridge and who has been measuring Arctic Ocean ice thickness from British Navy submarines, says that earlier calculations about Arctic sea ice loss have grossly underestimated how rapidly the ice is disappearing. He believes that the Arctic is likely to become ice-free before 2020 and possibly as early as 2015 or 2016 — decades ahead of projections made just a few years ago.
 
Do you think it was a worthy lead story when it was proven that professors were cooking the books on global warming?

But there was no such story. The only story was how your denialist leaders were caught in some of the most epic lies in history.

And you have your lips firmly planted on the the butts of those liars. It's what defines you denialists, the way you love the lie, worship the lie, and scream hatred at anyone who won't lie to you. After all, your political cult has given orders, and none of you denialist herdbeasts will risk the banishment from the herd which independent thought elicits.

By the way, I notice you call it 'climate change' now b/c you hacks are actually convinced you were wrong after all.

Er, no. The Bush administration invented the term, because they didn't want to admit to global warming. Do keep up with the basics, eh?
 
Quite simply --- he's wrong.

Quite simply, you posted a graph that ended at year 2000, and then pretended the last decade didn't exist. It's not the weirdest thing you've ever done, but it's up there.

Say, why don't you post a more current graph? Oh wait, that would debunk your claim. Looks like it's up to me.

6a0133f03a1e37970b016760fe3ca7970b-800wi


Dang. So much for your "but ... but ... the 1930's were just as bad!" claim. Keep trying. Your cult expects some top-quality cherrypicking out of you, and you don't dare disobey.

Not so fast Mamm... If you could READ a graph -- you'd see the one I posted from Nasa.gov actually shows DATA PAST 2000.. At least out to 2003 or 2004. It's just included in the trend line part of the graph.

arctic_temp_trends_rt.gif


Bigger question is why these don't agree.. I think we have an "instructional moment" here.

Quite frankly --- I don't trust ANY GISS data. But that's just me. And in the green graph I clipped a couple years ago -- there is OBVIOUSLY more variance in the data (light green) because there's much more RESOLUTION in the time axis.. IN FACT --- my graph shows MONTHLY data --- yours is obviously fictiously tortured with some kind of filtering without declaring it..

For instance in MINE --- the peak for the 30's warming is at 1935 with a pronounced DIP immediately following. In your's, the peak is not reached until 1940 with no pronounced dip..

In fact --- With the MONTHLY readings --- the highs of the 30's heating are exceeding the monthly highs of 2000.. None of that information shows in the GISS data prep..

Someone's screwing with the data again. My chart STILL links to Nasa.gov, but the I can't find the original text page it appeared on.. Hmmmmm.. You don't suppose it was PURGED do you?

And does GISS think we can't handle MONTHLY data resolution and do our own filtering? And how can an Arctic Temperature record CHANGE that dramatically over a few years?

Enquiring minds want to know..
 
So here we are with Dueling graphs that don't look the same for the 30s/40s and show MORE/LESS warming in the Arctic for the present warming trend.

How did we get here?? GISS has been caught adjusting this data for YEARS.. It's not as tho the RAW DATA changed -- it's that the data's been "adjusted and homogenized" MULTIPLE times a year for years.

So I guess we're gonna part ways on this about now.. I'll stick with the older "RAWER" data and more reasonable massages. You can have the fudge and remain completely oblivous to the tampering... We can BOTH be happy. But you will be dissappointed when all this "created" crisis comes tumbling down on it's own weight on your head.

Plenty of people have been following along with this data larceny -- it HAS happened.

Data Tampering: GISS Caught Red-Handed Manipulating Data To Produce Arctic Climate History Revision

Caryl4.gif


Caryl5.gif


Caryl9.gif


Note SPECIFICALLY the last graph that shows the result of COOLING THE 30s and WARMING the current era.. With a little boost for the pesky 1960/70 readings. If you were gonna "pad" your argument for AGW -- you couldn't ask for more could you?
This larceny is HAPPENING. That's why the graphs are different.

The first single station graph above --- is a blatant Cooling for the 30s/40s and a blatant boost for the 60s/70s.

A 0.5degC cooling added to the 1930s does WONDERS for the cause don't it?

I have verified the individual changes to many of these stations. IanC follows this in detail.

Nasa will still show you the diff between latest GISS and the PREVIOUS version -- but will NO LONGER make any earlier or RAW data available..

You figure it out...
 
Last edited:
So O.R. --- Means NOTHING to you that meager number of Arctic temp stations have been tampered with to WARM the 70s and COOL the 30s???

How ever would you warmers be able to make claims about how unprecedented things are TODAY -- if History wasn't being rewritten constantly? You all better store off a copy of that graph I posted.... I GUARANTEE it's slated to be purged....
 
Last edited:
So here we are with Dueling graphs that don't look the same for the 30s/40s and show MORE/LESS warming in the Arctic for the present warming trend.

How did we get here?? GISS has been caught adjusting this data for YEARS.. It's not as tho the RAW DATA changed -- it's that the data's been "adjusted and homogenized" MULTIPLE times a year for years.

So I guess we're gonna part ways on this about now.. I'll stick with the older "RAWER" data and more reasonable massages. You can have the fudge and remain completely oblivous to the tampering... We can BOTH be happy. But you will be dissappointed when all this "created" crisis comes tumbling down on it's own weight on your head.

Plenty of people have been following along with this data larceny -- it HAS happened.

Data Tampering: GISS Caught Red-Handed Manipulating Data To Produce Arctic Climate History Revision

Caryl4.gif


Caryl5.gif


Caryl9.gif


Note SPECIFICALLY the last graph that shows the result of COOLING THE 30s and WARMING the current era.. With a little boost for the pesky 1960/70 readings. If you were gonna "pad" your argument for AGW -- you couldn't ask for more could you?
This larceny is HAPPENING. That's why the graphs are different.

The first single station graph above --- is a blatant Cooling for the 30s/40s and a blatant boost for the 60s/70s.

A 0.5degC cooling added to the 1930s does WONDERS for the cause don't it?

I have verified the individual changes to many of these stations. IanC follows this in detail.

Nasa will still show you the diff between latest GISS and the PREVIOUS version -- but will NO LONGER make any earlier or RAW data available..

You figure it out...


I find it odd how so many people consider the temperature datasets as accurate and precise even though they change substantially decade-to-decade, year-to-year, and sometimes even month-to-month. they simply dont realize how apples are compared to oranges, then bananas, kiwis, mangoes, grapes, etc. which set was accurate? precise?when?

why arent we seeing graphs of like vs like? what are the shapes of minimum daily temps and maximum daily temps? if maximum daily temp trends are lower than mintemp daily trends does that support UHI and land use change or the CO2 hypothesis?are the adjustments for time of measurement bias reasonable? should they be attached to every measurement or are they better described as a one time step change?

I had great expectations of the BEST project because they promised open records and easy use of data to explore many different aspects of temperature analysis. unfortunately their statistician came up with an even more extreme form of adjustments that adds even more warming to the trend, and a method for looking at the UHI which amazingly enough proclaims that non premeable surfaces, heatsink buildings and extraneous heat sources actually decrease temperatures. no wonder none of the BEST papers has passed peer review yet. unfortunately I no longer believe that peer review will do the 'right thing'. there is obviously a deadlock because it has been over a year since they were submitted. will they be resubmitted to a more 'favourable' group of reviewers? will this be yet another scandal?
 
The glaciers continue to recede, the Arctic Ice is on a curve to be virtually gone for part of August and September between 2015 and 2020. Both Antarctica and Greenland are losing ice by the gigaton, and at an increasing rate. The weather extremes have increased in frequency. All of this is happening far faster than the alarmists ever predicted.

And you fellows are still stuck on it's all being made up. Lordy, lordy!

The ice has been melting by gigatons for the past 14,000 years
 

Forum List

Back
Top