Global Cooling Chills Summer

Again with the dumb act.
And for the record, you feebly DEFENDED UAH by stupidly posting a chart that didn't support the false UAH claim that the Earth had cooled by -1.45 C in the last 8.5 years or 102 months as compared to the previous century's average, when I attacked UAH as a credible source. So nowhere did I say you listed UAH as a source. Does that refresh your memory???

http://www.usmessageboard.com/1369933-post84.html

This is another typically dishonest technique of CON$ervatism, changing what actually was said or posted.
Just as I have not said anything about CO2 on this thread, but you choose to pretend I have, although one graph I posted from code's favorite right-wing denier's source, junkscience.com, did include a plot of CO2 levels along with the British Hadley data and they DID correspond quite nicely, but I only posted it for the Hadley data as code's link falsely claimed only the NOAA group supported the higher GISS/GISTEMT June 2009 data over the cooked UAH data and I said nothing about CO2. You probably don't remember that either. :lol:

UAH MSU 6-2009: +0.01 °C. Rank: 17/31
Warmest June in this series was in 1998.
Average last 12 months: 0.15 °C

GISTEMP 6-2009: +0.63 °C. Rank: 2/130
Warmest June in this series was in 1998.
Average last 12 months: 0.51 °C.

NCDC Anomaly 6-2009: +0.62 °C. Rank: 2/130
Warmest June in this series was in 2005.
Average last 12 months: 0.54 °C.

HadCRUT3 6-2009: +0.50 °C. Rank: 3/160
Warmest June in this series was in 1998.
Average last 12 months: 0.40 °C

HadAT 6-2009: +0.40 °C

HadCRUT3-1850.png

Can you produce one citation of a quote that I have posted here from Junk Science.com?

You forget I remember you from the AOL messageboards, and it was there that I found out about the junk science site from your links.

We all, check that, most of us grow and mature through experience. On the old A Oh Hell boards, I was just starting to dig into this stuff and was instructed by yourself and Rocks and others on sourcing.

Within the evolution I've gone through is my view on the overall topic from an AGW proponent to a doubter. Also, my approach is less of an attack dog and more of a fact checker. When a particular source, like GISS, is in varience to all of the other sources, it makes me wonder why.

As a result, I try to avoid sites that are obviously political. Junk Science is one. Real Climate is another. I notice that not all try to avoid these sites. The best sites are those that actually present data and present views not on the predictions but rather on the methodology which expose distance from the majority of the data collectoer's ranges.

When a series of experts review the various data sources and site GISS an outlier, it is telling.

Those who say that the world is ending from ocean rise, temperature rise, atmoshpere change and all the rest but scrupulously avoid any attempt to put any of their rhetoric into perspective are suspect. At least to me.

A 0.7 degree change in temperature across 2000 years is hardly the stuff of panic.
 
UAH MSU 6-2009: +0.01 °C. Rank: 17/31
Warmest June in this series was in 1998.
Average last 12 months: 0.15 °C

GISTEMP 6-2009: +0.63 °C. Rank: 2/130
Warmest June in this series was in 1998.
Average last 12 months: 0.51 °C.

NCDC Anomaly 6-2009: +0.62 °C. Rank: 2/130
Warmest June in this series was in 2005.
Average last 12 months: 0.54 °C.

HadCRUT3 6-2009: +0.50 °C. Rank: 3/160
Warmest June in this series was in 1998.
Average last 12 months: 0.40 °C

HadAT 6-2009: +0.40 °C

Can you produce one citation of a quote that I have posted here from Junk Science.com?

You forget I remember you from the AOL messageboards, and it was there that I found out about the junk science site from your links.

We all, check that, most of us grow and mature through experience. On the old A Oh Hell boards, I was just starting to dig into this stuff and was instructed by yourself and Rocks and others on sourcing.

Within the evolution I've gone through is my view on the overall topic from an AGW proponent to a doubter. Also, my approach is less of an attack dog and more of a fact checker. When a particular source, like GISS, is in varience to all of the other sources, it makes me wonder why.

As a result, I try to avoid sites that are obviously political. Junk Science is one. Real Climate is another. I notice that not all try to avoid these sites. The best sites are those that actually present data and present views not on the predictions but rather on the methodology which expose distance from the majority of the data collectoer's ranges.

When a series of experts review the various data sources and site GISS an outlier, it is telling.

Those who say that the world is ending from ocean rise, temperature rise, atmoshpere change and all the rest but scrupulously avoid any attempt to put any of their rhetoric into perspective are suspect. At least to me.

A 0.7 degree change in temperature across 2000 years is hardly the stuff of panic.

BALONEY!!!
You were ALWAYS a denier using junkscience as long as I debated you on AOL.

And being a denier does not make someone a "series of experts" and GISS is not the outlier, UAH is clearly the outlier so why don't apply your suspicions to them???

Finally, you yourself in this very thread spun a +.01 June reading from your UAH outlier into a point and a half drop in your "woopsie" post!!!!
Now that puts YOUR "rhetoric into perspective!"

http://www.usmessageboard.com/1351892-post60.html
 
And when the next El Nino results in a year or two warmer than either 1998 or 2005, you are going to answer that with more meaningless yapping?

Of course you would latch onto the El Nino effect that happens every 3 to 8 years to try and verify AGW....:cuckoo:

LOL. OK, idiot. We'll go real slow, maybe you can understand. We had a strong and persistant La Nina that coincided with a unussualy quiet solar minimum. A solar minimum that is still with us, as the sun is still very quiet. And you fellows have been trumpeting that as proof that we are rapidly cooling. So rapidly that 2008 tied 2001 as the eighth warmest year on record. Yet June was the second warmest June on record in 130 years. And the El Nino is just starting.

So, when we were supposed to be getting fast and hard cooling, it was still warming. And now, when we have an El Nino, with a quiet sun, we may well have a year that exceeds 1998 and 2005. No one has to latch onto the El Nino to prove AGW, the fact that we are still in an accelerating warming is obvious to all but the most politically motivated or dense.
From your post...
"OK, idiot"

"We had a strong and persistant La Nina that coincided with a unussualy quiet solar minimum."

Persistent Definition | Definition of Persistent at Dictionary.com
persistent-
1. persisting, esp. in spite of opposition, obstacles, discouragement, etc.; persevering: a most annoyingly persistent young man.
2. lasting or enduring tenaciously: the persistent aroma of verbena; a persistent cough.
3. constantly repeated; continued: persistent noise.
4. Biology.
a. continuing or permanent.
b. having continuity of phylogenetic characteristics.
5. Botany. remaining attached beyond the usual time, as flowers, flower parts, or leaves.


Unusually Definition | Definition of Unusually at Dictionary.com
un⋅u⋅su⋅al
 

–adjective
not usual, common, or ordinary; uncommon in amount or degree; exceptional: an unusual sound; an unusual hobby; an unusual response.
Origin:
1575–85; un- 1 + usual

Related forms:
un⋅u⋅su⋅al⋅ly, adverb
un⋅u⋅su⋅al⋅ness, noun

Idiot...

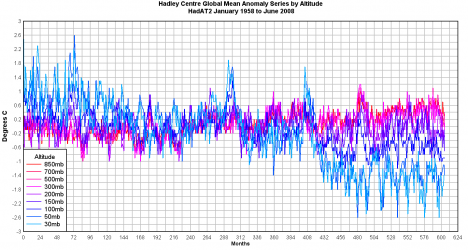
http://wattsupwiththat.files.wordpress.com/2008/08/hadat2_june2008.png$hadat2_june2008.png
 
Last edited:
UAH MSU 6-2009: +0.01 °C. Rank: 17/31
Warmest June in this series was in 1998.
Average last 12 months: 0.15 °C

GISTEMP 6-2009: +0.63 °C. Rank: 2/130
Warmest June in this series was in 1998.
Average last 12 months: 0.51 °C.

NCDC Anomaly 6-2009: +0.62 °C. Rank: 2/130
Warmest June in this series was in 2005.
Average last 12 months: 0.54 °C.

HadCRUT3 6-2009: +0.50 °C. Rank: 3/160
Warmest June in this series was in 1998.
Average last 12 months: 0.40 °C

HadAT 6-2009: +0.40 °C

You forget I remember you from the AOL messageboards, and it was there that I found out about the junk science site from your links.

We all, check that, most of us grow and mature through experience. On the old A Oh Hell boards, I was just starting to dig into this stuff and was instructed by yourself and Rocks and others on sourcing.

Within the evolution I've gone through is my view on the overall topic from an AGW proponent to a doubter. Also, my approach is less of an attack dog and more of a fact checker. When a particular source, like GISS, is in varience to all of the other sources, it makes me wonder why.

As a result, I try to avoid sites that are obviously political. Junk Science is one. Real Climate is another. I notice that not all try to avoid these sites. The best sites are those that actually present data and present views not on the predictions but rather on the methodology which expose distance from the majority of the data collectoer's ranges.

When a series of experts review the various data sources and site GISS an outlier, it is telling.

Those who say that the world is ending from ocean rise, temperature rise, atmoshpere change and all the rest but scrupulously avoid any attempt to put any of their rhetoric into perspective are suspect. At least to me.

A 0.7 degree change in temperature across 2000 years is hardly the stuff of panic.

BALONEY!!!
You were ALWAYS a denier using junkscience as long as I debated you on AOL.

And being a denier does not make someone a "series of experts" and GISS is not the outlier, UAH is clearly the outlier so why don't apply your suspicions to them???

Finally, you yourself in this very thread spun a +.01 June reading from your UAH outlier into a point and a half drop in your "woopsie" post!!!!
Now that puts YOUR "rhetoric into perspective!"

http://www.usmessageboard.com/1351892-post60.html

I didn't spin anything. I highlighted something that was said by someone else.

This source that you revile so often is what it is. It reflects all of the other sources except GISS in it's variences. GISS shows rising temperatures COMPARED TO TEMPERATURES IN ITS OWN SEQUENCE while the outher sources show declining temperatures COMPARED TO TEMPERATURES IN THEIR OWN SEQUENCES. We have had this discussion before and you immediately change the subject.

This is not to say that they all have the same starting or ending points, but most very within a range and GISS is outside of that range of varience.

The plus .1 degree that you seem to ignor, iI can't really determine what it is that you are citing in that link, indicates that the measured month is only .1 degree above the average established for the baseline.

This means that the measured month was less warm than many others that were measured. It was. Only GISS departs from this conclusion. After Hansen adjusts the readings, it will be less cool than it actually was by whatever factor he cooks.

The temperature listed is important only as a comparator within the given series. If the calibration for any particular series is consistant to itself, there will be consistant variation. For all of the major data collectors, except GISS, the variations are roughly equal. This is what makes GISS the outlier.

The anomoly graphs are interesting in that they equalize all of the months of any year and show whether there is warming month by month. That was why the .1 was important and why I returned to that post to highlight it.

By the by, I had thoughts prior to posting on message boards. It was before I started digging into this stuff that i was a proponent. The more I learned, the less convinced i became. That same process goes on.
 
Last edited:
BAM! Check out all those cold temps!

Cold June in Manhattan well below normal.

Among coldest Junes in Pheonix since 1913.

LA came in at 5 degrees below normal.

Boston almost 5 degrees below normal.

New Zealand climate center releases headline - Temperatures: Lowest ever for May in many areas, colder than normal for all.

Two South African vagrants froze to death.

Chicago had the COLDEST July 8th since 1891.

Yonkers received a snow storm - in JULY.

In Melbourne Australia, temps have been 10 degrees BELOW normal.


Global Cooling Chills Summer 2009 by Deroy Murdock on National Review Online

By the way, the earth's temperature has dropped .74 degrees since Al Gore released an Inconvenient Truth in 2006...

,,,
 
BAM! Check out all those cold temps!

Cold June in Manhattan well below normal.

Among coldest Junes in Pheonix since 1913.

LA came in at 5 degrees below normal.

Boston almost 5 degrees below normal.

New Zealand climate center releases headline - Temperatures: Lowest ever for May in many areas, colder than normal for all.

Two South African vagrants froze to death.

Chicago had the COLDEST July 8th since 1891.

Yonkers received a snow storm - in JULY.

In Melbourne Australia, temps have been 10 degrees BELOW normal.


Global Cooling Chills Summer 2009 by Deroy Murdock on National Review Online

By the way, the earth's temperature has dropped .74 degrees since Al Gore released an Inconvenient Truth in 2006...
,,,


Hmmm... The Globe has cooled. Has the rhetoric also cooled?

Hardly - the warmers are ramping up the GW stories big time during the summer - like clockwork...
 
Information from Global Hydrology and Climate Center, University of Alabama - Huntsville, USA The data from which the graphs are derived can be downloaded here.
Temperature Variation From Average:
Lower Troposphere:
Global:
June 2009: +0.01 °C
Northern Hemisphere: +0.04 °C
Southern Hemisphere: -0.02 °C
Peak recorded anomaly:
February, 1998: +0.76 °C
Current relative to peak recorded: -0.75 °CDECADAL TREND:
Global: +0.12 °C
Northern Hemisphere: +0.19 °C
Southern Hemisphere: +0.06 °C
Last update: July 7, 2009
Woopsie! Forgot to highlight this in the original response, but I suppose this does desrve its own response:

+.76 down to -.75 seems to be about a point and a half reduction.

Finally, you yourself in this very thread spun a +.01 June reading from your UAH outlier into a point and a half drop in your "woopsie" post!!!!
Now that puts YOUR "rhetoric into perspective!"

http://www.usmessageboard.com/1351892-post60.html

I didn't spin anything. I highlighted something that was said by someone else.

Well, let's see whether you quoted UAH or or spun their cooked numbers even more than they do.

You took the +.01 June 2009 and changed it to -.75 by using the difference between June 2009 and February 1998 as the June 2009 temp. You then compared your cooked -.75 June 2009 creation to the +.76 February 1998 temp to get your point and a half reduction.

That is not highlighting "something that was said by someone else" by any standard except to a CON$ervative spin doctor. :cuckoo:

Of course the University of Alabama at Huntsville cooks their numbers...:cuckoo:

Because they don't agree with the minions of hypocrites. You are aware that CH4 has a higher global warming potential than CO2 correct? Are you a vegan?
 
Last edited:
I was saying to EZ that our temps here are whacked. Aug 2nd, 77F. Warmer than in days. I don't know that we've hit 90F this summer. I do know that most days we've been in low 80's or high 70's. Most nights into low 60's and even low 50's. Chicago is NOT MN.
 
UAH MSU 6-2009: +0.01 °C. Rank: 17/31
Warmest June in this series was in 1998.
Average last 12 months: 0.15 °C

GISTEMP 6-2009: +0.63 °C. Rank: 2/130
Warmest June in this series was in 1998.
Average last 12 months: 0.51 °C.

NCDC Anomaly 6-2009: +0.62 °C. Rank: 2/130
Warmest June in this series was in 2005.
Average last 12 months: 0.54 °C.

HadCRUT3 6-2009: +0.50 °C. Rank: 3/160
Warmest June in this series was in 1998.
Average last 12 months: 0.40 °C

HadAT 6-2009: +0.40 °C

We all, check that, most of us grow and mature through experience. On the old A Oh Hell boards, I was just starting to dig into this stuff and was instructed by yourself and Rocks and others on sourcing.

Within the evolution I've gone through is my view on the overall topic from an AGW proponent to a doubter. Also, my approach is less of an attack dog and more of a fact checker. When a particular source, like GISS, is in varience to all of the other sources, it makes me wonder why.

As a result, I try to avoid sites that are obviously political. Junk Science is one. Real Climate is another. I notice that not all try to avoid these sites. The best sites are those that actually present data and present views not on the predictions but rather on the methodology which expose distance from the majority of the data collectoer's ranges.

When a series of experts review the various data sources and site GISS an outlier, it is telling.

Those who say that the world is ending from ocean rise, temperature rise, atmoshpere change and all the rest but scrupulously avoid any attempt to put any of their rhetoric into perspective are suspect. At least to me.

A 0.7 degree change in temperature across 2000 years is hardly the stuff of panic.
BALONEY!!!
You were ALWAYS a denier using junkscience as long as I debated you on AOL.

And being a denier does not make someone a "series of experts" and GISS is not the outlier, UAH is clearly the outlier so why don't apply your suspicions to them???

Finally, you yourself in this very thread spun a +.01 June reading from your UAH outlier into a point and a half drop in your "woopsie" post!!!!
Now that puts YOUR "rhetoric into perspective!"

http://www.usmessageboard.com/1351892-post60.html

I didn't spin anything. I highlighted something that was said by someone else.

This source that you revile so often is what it is. It reflects all of the other sources except GISS in it's variences. GISS shows rising temperatures COMPARED TO TEMPERATURES IN ITS OWN SEQUENCE while the outher sources show declining temperatures COMPARED TO TEMPERATURES IN THEIR OWN SEQUENCES. We have had this discussion before and you immediately change the subject.

This is not to say that they all have the same starting or ending points, but most very within a range and GISS is outside of that range of varience.

The plus .1 degree that you seem to ignor, iI can't really determine what it is that you are citing in that link, indicates that the measured month is only .1 degree above the average established for the baseline.

This means that the measured month was less warm than many others that were measured. It was. Only GISS departs from this conclusion. After Hansen adjusts the readings, it will be less cool than it actually was by whatever factor he cooks.

The temperature listed is important only as a comparator within the given series. If the calibration for any particular series is consistant to itself, there will be consistant variation. For all of the major data collectors, except GISS, the variations are roughly equal. This is what makes GISS the outlier.

The anomoly graphs are interesting in that they equalize all of the months of any year and show whether there is warming month by month. That was why the .1 was important and why I returned to that post to highlight it.

By the by, I had thoughts prior to posting on message boards. It was before I started digging into this stuff that i was a proponent. The more I learned, the less convinced i became. That same process goes on.

Well there you go again code, lying in the face of the facts. There are three other sources listed at the top of the post that agree with GISS including the British Hadley Center which has nothing to do with Hansen. And it is Christie and Spencer at UAH who got caught deliberately using the wrong sign to "correct" for diurnal satellite drift to get their low numbers.

Satellite show little to no warming in the troposphere

By the way, they are up to version 5.2 of their "correction" standard and they have announced that they are working on another version to get the numbers even lower, so why don't you question all their changes to get their cooked numbers if you are so fair and balanced????

[FONT=arial, verdana, helvetica][FONT=arial, verdana, helvetica]From UAH Update 19 Dec 2007 *****************************

As noted below, the diurnal drift of NOAA-15 is becoming more obvious. We are still working on a correction scheme to remove this spurious warming effect. Through comparison with other AMSUs, the warming drift by Oct and Nov is on the order of 0.2 C (i.e. the values of v5.2 are too warm for TLT by that amount.) This has been a long ordeal because we want to create a correction that will stand the test of time. End update
[/FONT]
[/FONT]
 
UAH MSU 6-2009: +0.01 °C. Rank: 17/31
Warmest June in this series was in 1998.
Average last 12 months: 0.15 °C

GISTEMP 6-2009: +0.63 °C. Rank: 2/130
Warmest June in this series was in 1998.
Average last 12 months: 0.51 °C.

NCDC Anomaly 6-2009: +0.62 °C. Rank: 2/130
Warmest June in this series was in 2005.
Average last 12 months: 0.54 °C.

HadCRUT3 6-2009: +0.50 °C. Rank: 3/160
Warmest June in this series was in 1998.
Average last 12 months: 0.40 °C

HadAT 6-2009: +0.40 °C


BALONEY!!!
You were ALWAYS a denier using junkscience as long as I debated you on AOL.

And being a denier does not make someone a "series of experts" and GISS is not the outlier, UAH is clearly the outlier so why don't apply your suspicions to them???

Finally, you yourself in this very thread spun a +.01 June reading from your UAH outlier into a point and a half drop in your "woopsie" post!!!!
Now that puts YOUR "rhetoric into perspective!"

http://www.usmessageboard.com/1351892-post60.html

I didn't spin anything. I highlighted something that was said by someone else.

This source that you revile so often is what it is. It reflects all of the other sources except GISS in it's variences. GISS shows rising temperatures COMPARED TO TEMPERATURES IN ITS OWN SEQUENCE while the outher sources show declining temperatures COMPARED TO TEMPERATURES IN THEIR OWN SEQUENCES. We have had this discussion before and you immediately change the subject.

This is not to say that they all have the same starting or ending points, but most very within a range and GISS is outside of that range of varience.

The plus .1 degree that you seem to ignor, iI can't really determine what it is that you are citing in that link, indicates that the measured month is only .1 degree above the average established for the baseline.

This means that the measured month was less warm than many others that were measured. It was. Only GISS departs from this conclusion. After Hansen adjusts the readings, it will be less cool than it actually was by whatever factor he cooks.

The temperature listed is important only as a comparator within the given series. If the calibration for any particular series is consistant to itself, there will be consistant variation. For all of the major data collectors, except GISS, the variations are roughly equal. This is what makes GISS the outlier.

The anomoly graphs are interesting in that they equalize all of the months of any year and show whether there is warming month by month. That was why the .1 was important and why I returned to that post to highlight it.

By the by, I had thoughts prior to posting on message boards. It was before I started digging into this stuff that i was a proponent. The more I learned, the less convinced i became. That same process goes on.

Well there you go again code, lying in the face of the facts. There are three other sources listed at the top of the post that agree with GISS including the British Hadley Center which has nothing to do with Hansen. And it is Christie and Spencer at UAH who got caught deliberately using the wrong sign to "correct" for diurnal satellite drift to get their low numbers.

Satellite show little to no warming in the troposphere

By the way, they are up to version 5.2 of their "correction" standard and they have announced that they are working on another version to get the numbers even lower, so why don't you question all their changes to get their cooked numbers if you are so fair and balanced????

[FONT=arial, verdana, helvetica][FONT=arial, verdana, helvetica]From UAH Update 19 Dec 2007 *****************************

As noted below, the diurnal drift of NOAA-15 is becoming more obvious. We are still working on a correction scheme to remove this spurious warming effect. Through comparison with other AMSUs, the warming drift by Oct and Nov is on the order of 0.2 C (i.e. the values of v5.2 are too warm for TLT by that amount.) This has been a long ordeal because we want to create a correction that will stand the test of time. End update
[/FONT]
[/FONT]
Methane - Wikipedia, the free encyclopedia
The abundance of methane in the Earth's atmosphere in 1998 was 1745 parts per billion, up from 700 ppb in 1750. Methane can trap about 20 times the heat of CO2. In the same time period, CO2 increased from 278 to 365 parts per million. The radiative forcing effect due to this increase in methane abundance is about one-third of that of the CO2 increase.[2] In addition, there is a large, but unknown, amount of methane in methane clathrates in the ocean floors. The Earth's crust contains huge amounts of methane. Large amounts of methane are produced anaerobically by methanogenesis. Other sources include mud volcanoes, which are connected with deep geological faults, and livestock (primarily cows) from enteric fermentation.


Are you a vegan?
 
Woopsie! Forgot to highlight this in the original response, but I suppose this does desrve its own response:

+.76 down to -.75 seems to be about a point and a half reduction.

I didn't spin anything. I highlighted something that was said by someone else.

Well, let's see whether you quoted UAH or or spun their cooked numbers even more than they do.

You took the +.01 June 2009 and changed it to -.75 by using the difference between June 2009 and February 1998 as the June 2009 temp. You then compared your cooked -.75 June 2009 creation to the +.76 February 1998 temp to get your point and a half reduction.

That is not highlighting "something that was said by someone else" by any standard except to a CON$ervative spin doctor. :cuckoo:

Of course the University of Alabama at Huntsville cooks their numbers...:cuckoo:

Because they don't agree with the minions of hypocrites. You are aware that CH4 has a higher global warming potential than CO2 correct? Are you a vegan?

No, their numbers are cooked because they got caught using the opposite sign in their "correction" for diurnal satellite drift.

I notice you have not addressed your point and a half exaggeration, but instead try to change the subject. But just for the record, I've been a vegetarian since 1968, not that it's relevant to your exaggeration.

Methodology & Error Correction

The Effect of Diurnal Correction on Satellite-Derived Lower Tropospheric Temperature
CA Mears and FJ Wentz. Science, published online 11 August 2005

This is the August 2005 paper first published online at Science Express (subscription required for full text) in which Carl Mears and Frank Wentz of RSS present their discovery that UAH MSU products had been applying corrections to the MSU data from the NOAA-11 satellite in the wrong direction, thereby introducing a spurious cooling into UAH analyses. When the error was corrected, beginning with UAH Version 5.1 (Christy et al, 2005) this record’s disagreement with extant climate model predictions of global warming all but vanished and with it the only potentially credible argument global warming skeptics ever had. The NOAA TIROS Series of satellites that carry the MSU packages are in polar orbits that are sun-synchronous (i.e.—in orbits that preserve their orbital plane with respect to the sun throughout the year so that they rise and set in the sky at the same time on any given day and location during their service lives). Imperfections in this sun/satellite synchronicity cause a drift in the satellite’s daily rising and setting times during its life that will appear to the sensor as a spurious warming or cooling depending on the direction (it’s usually much cooler at 6 AM than it is at noon!). This is referred to as diurnal drift. NOAA-11 had a comparatively large one—enough so that reversing the correction for it was enough to spuriously remove most of the warming that should have been present in UAH products.
Then you would understand the difference between a vegetarian and a vegan....liar and hypocrite.

I don't eat meat of any kind, not even fish or chicken. But what does that have to do with the undeniable fact that UAH cooked their numbers by calling the cooling effect of diurnal drift a warming effect and deliberately using the opposite sign in their "correction," other than to change the subject from the fact that the only cherry-picked data deniers have has been proven to be cooked?!!!
 
No, their numbers are cooked because they got caught using the opposite sign in their "correction" for diurnal satellite drift.

I notice you have not addressed your point and a half exaggeration, but instead try to change the subject. But just for the record, I've been a vegetarian since 1968, not that it's relevant to your exaggeration.
Then you would understand the difference between a vegetarian and a vegan....liar and hypocrite.

I don't eat meat of any kind, not even fish or chicken. But what does that have to do with the undeniable fact that UAH cooked their numbers by calling the cooling effect of diurnal drift a warming effect and deliberately using the opposite sign in their "correction," other than to change the subject from the fact that the only cherry-picked data deniers have has been proven to be cooked?!!!

I don't know, maybe to show the whole crux of your side's argument is hypocritical, unless you are a vegan. Considering that CH4 has 20 times more heating potential than CO2.

Again, I have made no claims about CO2 or CH4. I have merely pointed out that deniers are lying when they claim Global Cooling for the last decade. Obviously I have proven my argument so thoroughly that deniers have no choice but to change the subject.
Your white flag is accepted. Thank you.

a Liar and a hypocrite....your concessions are duly noted. No one has stated that at some points in history the earth has cooled and warmed. I think the point of disagreement is to do with the relevance of man's role in said heating and cooling.

Again, if you look at the posts I replied to, you will see the deniers claimed that either there was global cooling for the last decade even though the decade of 1999 to 2008 was the warmest in the history of direct instrument measurement, or we've been cooling since 2001 even though every year after 2001 has been warmer than 2001. Deniers then went on to challenge the accuracy of the measurements and I pointed out the flaws in their arguments. It was you and code who were trying to change the debate over the accuracy of the UAH data to veganism, not me.
Deniers of what? AGW correct?
Disproving The Anthropogenic Global Warming (AGW) Problem « Watts Up With That?
AGW
A theory has been proposed that human activity over about the last 150 years has caused a significant rise in Earth’s average temperature. The mechanism claimed is based on an increased greenhouse effect caused by anthropogenic increases in CO2 from burning of fossil fuels, deforestation, cement manufacture, and also from increases in CH4 from farm animals and other causes.


Veganism would have a lot to do with this debate, since CH4 is 20 times more likely to trap heat. Unfortunately, you being the hypocrite you are, would like to play stupid that you alone could eliminate 1.5 billion tons of CO2 emissions a year by becoming a vegan, according to the IPCC. But do continue to focus on others its entertaining...:lol:
 

Forum List

Back
Top