France record temperature.....more fakery!!

The industrial revolution began towards the end of the little ice age....the earth has been warming out of the little ice age ever since...warmer oceans, warmer land equals more outgassing and more efficient decay of organic materials both on land and in the oceans resulting in more CO2...all the available hard data show that increased CO2 is the result of warming...not the cause...this is a very simple concept to grasp and has shown itself to be accurate in ice core after ice core after ice core...one wonders why you deny this well known science in favor of pseudoscience.

And then there is the fact that the earth hasn't even warmed to the temperatures that existed prior to the onset of the little ice age....do you find it unusual that we wouldn't at least warm that far considering that the earth is in the process of exiting an ice age?
-Previous warming periods. I'm talking about coming out of actual ice ages have NEVER in the history of the known records caused an increase in CO2 levels to over 400ppm not even close.

We are still in an ice age and it has been going on for a hell of a lot more than 800,000 years....those peaks and valleys your graph showed are interproximals...and the further we get from the depths of ice age, the more CO2 will be released into the atmosphere...and again...the ice cores can tell us that increases in CO2 follow warming, but they don't really give us really reliable numbers regarding the actual CO2 concentrations of the time...this is well known and accepted by both skeptics and alarmists...it isn't difficult to find if you have any interest in learning at all.
That graph didn't show an increase in the amount of CO2 as they were going from one interglacial to another. That jump only happened now. And not over the periods that rising CO2 levels usually take from low to high end but that last 100 ppm happened considerably faster.

The CO2 concentrations in that graph and any other graph derived from ice cores are dubious at best...this isn't a secret...any climate scientist will tell you that the numbers are not reliable...hell even alarmist quagmires like skeptical science acknowledge that the only argument that is possible to make regarding gasses derived from ice cores is that they show that increases in CO2 follow temperature increases... there is no argument to be made with ice cores other than that they show increased CO2 follows increased temperatures and warming and cooling periods within interglacials are natural, and that the present is considerably cooler than it has been for most of the past 10,000 years.
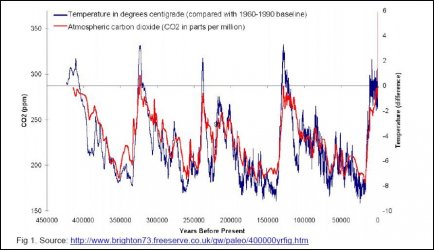
Not reliable? Their ranges are consistent though. Do you have any reason to believe that those ranges are off by a factor of about 100 percent besides the fact that you don't believe it personally? Cause they would have to be to explain the current CO2 levels.

No...they are not consistent...the further back you go, the more unreliable they get...if there were any validity in the gas concentrations derived from ice core samples, it would be a big deal and you would be bombarded with the data at every turn...like I said, even climate science acknowledges that the only thing that can be derived with any degree of confidence from ice core data is that warming and cooling are cyclical within ice ages, that increases in CO2 follow warming, and that the present is cooler than most of the past 10,000 years.
 
The Man Made Climate NAZI's have been changing and manipulating temperature data, and other factors to get the results THEY WANT in their flawed modelling. The Communists in Europe may believe your B.S., but thinking America doesn't. It is the weak minded, statists, and globalists, (the brainwashed) that believe in MAN MADE climate change.

The Sun and some other NATURAL factors affect weather and climate.
But this has absolutely nothing to do with any of it.
china-smog-agencies.jpg

That is air pollution...not to be confused with climate change...air pollution is a real problem with a real solution but alas, nothing much will be done about it, or any of the other serious environmental issues, with actual solutions so long as the climate change scam is sucking all of the air out of the room and all the treasure out of the coffers...
 
and
Now as promised.
Hypothesis: Man is making the earth warmer by emitting CO2 in the atmosphere at an unsustainable rate.

-First, this means we have to establish that the earth's CO2 level is rising. I will suppose you don't challenge that CO2 is a greenhouse gas?

First, the scientific method demands that you establish that rising CO2 levels actually cause warming.. To date, there is no observed, measured evidence which establishes any coherent link between the absorption of infrared radiation by a gas and warming in the atmosphere. Do feel free to provide some if you think any exists. Without that, no amount of demonstration that CO2 levels are rising mean anything at all.


Thus far, I have provided 8 published studies that find that the atmospheric CO2 levels are rising but all find that we are not the ones driving the increase. They find that we don't even produce enough CO2 to overcome the natural variation from year to year in the earth's own CO2 making mechanisms...They find that rising CO2 levels are the result of warming..not the cause of it.


More of the same...published science finds that we are not the ones driving atmospheric CO2 levels...and then there is the issue with demonstrating a coherent relationship between the absorption of infrared radiation by a gas, and warming in the atmosphere.

That is a verifiable fact, isn't it?

Of course...CO2 levels are greater now than they have been in the relatively recent past, but that doesn't mean anything...Hell, the present ice age began with atmospheric CO2 levels in the 1000ppm range compared to our 400ppm....like I said, I have provided ample published science that finds that we are not the ones driving atmospheric CO2 levels...and in fact, our contribution to CO2 levels is vanishingly small. And again, there is no observed, measured evidence that demonstrates that rising CO2 causes warming...all the observed evidence shows that increasing CO2 is the result of warming...not the cause

-Second, we need to establish that CO2 is trapping heat.

Good luck with that...if CO2 trapped heat, there would be an inevitable tropospheric hot spot...alas, no such hot spot exists.


Again...the key word there is inferred...not observed, not measured, not anything but inferred and that is 20 years out of date...the claim went nowhere because it simply wasn't supportable by the evidence.

Here are some of the graphs from that paper..

This first image shows outgoing long wave radiation at the top of the atmosphere in 1970 vs 1997 The dark line is the IMG data (from 1997), and the gray line is the IRIS line (from (1970). The 1997 OLR associated with CO2 is identical to that in 1970.

GT%20pic2.jpg


This next graph shows the OLR emission from TES (in 2006). The black line is the actual measurement data, the red line is what the climate models show, and the blue line is the difference between the actual and model data.


GT%20pic3.jpg


This last graph shows the OLR emission from IMG (1997). Just like the previous figure, the black line is the actual measurement data, the red line is what the climate models show, and the blue line is the difference between actual and model data.

GT%20pic4.jpg


Print out the TES image showing the outgoing long wave in 2006 and the IRIS image showing outgoing long wave in 1970 and overlay them...they are identical in the CO2 wavelengths.

There is a reason that the study went nowhere....it didn't make the case.

This shows 2 different IR satellites showing a steady drop in radiation going out at the wavelengths of CO2.
Again verifiable.

Sorry guy....it shows nothing of the sort...print out the graphs and overlay them...no change in the outgoing long wave in the CO2 wavelengths between 1970 and 2006 in spite of considerable increases in atmospheric CO2.

Again...if CO2 were trapping energy, there would be an investable hot spot in the upper troposphere...no such hot spot exists...

P1.7 Measurements of the Radiative Surface Forcing of Climate (2006 - Annual2006_18climatevari)
This shows an analysis of high-resolution spectral data from the surface and isolates the different greenhouse gasses.

A fine example of being fooled by instrumentation...the instruments they are using are cooled to a temperature of roughly -80F....they are not measuring energy moving from the cooler atmosphere to the warmer earth...they are measuring energy moving from the warmer atmosphere to the cooler instrument...place another identical instrument except uncooled next to the cooled one, and you won't measure any downdwelling radiation. The second law of thermodynamics says that it is not possible for energy to move from a cooler region to a warmer region without some work having been done to make that energy movement possible.

Second Law of Thermodynamics: It is not possible for heat to flow from a colder body to a warmer body without any work having been done to accomplish this flow. Energy will not flow spontaneously from a low temperature object to a higher temperature object.


Error - Cookies Turned Off
This one is a study of heat buildup.

That is nothing but the output of models...failing models I might add...no empirical evidence there

-Lastly, we have to establish that humans are the cause of this rise in CO2.
U.S. Energy Information Administration (EIA) - Total Energy Annual Data
Here you see a precise calculation of all energy sources in the US similar information exists by nation.

I am not sure where you believe there is any empirical data demonstrating or establishing that we are the cause of the rise in CO2. All that shows is that humans produce CO2 and that different countries produce different amounts...all of our CO2 combined isn't even as much as termites make...Like I said, we don't produce enough CO2 to even overcome the natural variation from year to year in the earth's own CO2 making mechanism.

Here are several peer reviewed, published studies which show very clearly that our effect on the total atmospheric CO2 is largely unmeasurable.. human beings, with all our CO2 producing capacity don't even make enough CO2 to overcome the year to year variation in the earth's own CO2 making machinery...

The fact is that the amount of CO2 we produce from year to year does not track with the amount of increase in atmospheric CO2.

https://www.researchgate.net/public...SPHERIC_CO2_TO_ANTHROPOGENIC_EMISSIONS_A_NOTE

CLIP: “A necessary condition for the theory of anthropogenic global warming is that there should be a close correlation between annual fluctuations of atmospheric CO2 and the annual rate of anthropogenic CO2 emissions. Data on atmospheric CO2 and anthropogenic emissions provided by the Mauna Loa measuring station and the CDIAC in the period 1959-2011 were studied using detrended correlation analysis to determine whether, net of their common long term upward trends, the rate of change in atmospheric CO2 is responsive to the rate of anthropogenic emissions in a shorter time scale from year to year. … [R]esults do not indicate a measurable year to year effect of annual anthropogenic emissions on the annual rate of CO2 accumulation in the atmosphere.”


CO2-Emissions-vs-CO2-ppm-concentration.jpg


If you look at the graph...assuming that you can read a graph...you will see for example, that there was a rise in our emissions between 2007 and 2008 but a significant decline in the atmospheric CO2 concentration. Do you believe that human CO2 went somewhere to hide and waited around for some years before it decided to have an effect on the total atmospheric CO2 concentration? Then between 2008 and 2009, there was a decline in the amount of CO2 that humans emitted into the atmosphere, but a significant rise in the atmospheric CO2 concentration. Then from 2010 to 2014 there was a large rise in man made CO2 emissions but an overall flat to declining trend in the atmospheric CO2 concentration. Between 2014 to 2016 there was a slight decline in man made CO2 emissions, but a pronounced rise in the atmospheric CO2 concentrations. Like I said, we produce just a fraction of the natural variation in the earth's own CO2 making machinery from year to year and we are learning that we really don't even have a handle on how much CO2 the earth is producing...the undersea volcanoes are a prime example of how much we don't know.


https://www2.meteo.uni-bonn.de/bibliothek/Flohn_Publikationen/K287-K320_1981-1985/K299.pdf

CLIP: The recent increase of the CO2-content of air varies distinctly from year to year, rather independent from the irregular annual increase of global CO2-production from fossil fuel and cement, which has since 1973 decreased from about 4.5 percent to 2.25 percent per year (Rotty 1981).”

Comparative investigations (Keeling and Bacastow 1977, Newll et al. 1978, Angell 1981) found a positive correlation between the rate of increase of atmospheric CO2 and the fluctuations of sea surface temperature (SST) in the equatorial Pacific, which are caused by rather abrupt changes between upwelling cool water and downwelling warm water (“El Niño”) in the eastern equatorial Pacific. Indeed the cool upwelling water is not only rich in (anorganic) CO2 but also in nutrients and organisms. (algae) which consume much atmospheric CO2 in organic form, thus reducing the increase in atmospehreic CO2. Conversely the warm water of tropical oceans, with SST near 27°C, is barren, thus leading to a reduction of CO2 uptake by the ocean and greater increase of the CO2. … A crude estimate of these differences is demonstrated by the fact that during the period 1958-1974, the average CO2-increase within five selective years with prevailing cool water only 0.57 ppm/a [per year], while during five years with prevailing warm water it was 1.11 ppm/a. Thus in a a warm water year, more than one Gt (1015 g) carbon is additionally injected into the atmosphere, in comparison to a cold water year.”


Practically every actual study ever done tells us that increases in CO2 follow increases in temperature...that means that increased CO2 is the result of increased temperature, not the cause of increased temperature...which makes sense since warm oceans hold less CO2 and as they warm, they outages CO2.

https://www.researchgate.net/public...spheric_carbon_dioxide_and_global_temperature

Temperature-Change-Leads-CO2-Growth-Change.jpg


CLIP"
“There exist a clear phase relationship between changes of atmospheric CO2 and the different global temperature records, whether representing sea surface temperature, surface air temperature, or lower troposphere temperature, with changes in the amount of atmospheric CO2 always lagging behind corresponding changes in temperature.”

(1) The overall global temperature change sequence of events appears to be from 1) the ocean surface to 2) the land surface to 3) the lower troposphere.

(2) Changes in global atmospheric CO2 are lagging about 11–12 months behind changes in global sea surface temperature.

(3) Changes in global atmospheric CO2 are lagging 9.5–10 months behind changes in global air surface temperature.

(4) Changes in global atmospheric CO2 are lagging about 9 months behind changes in global lower troposphere temperature.

(5) Changes in ocean temperatures appear to explain a substantial part of the observed changes in atmospheric CO2 since January 1980.

(6) CO2 released from anthropogenic sources apparently has little influence on the observed changes in atmospheric CO2, and changes in atmospheric CO2 are not tracking changes in human emissions.

(7) On the time scale investigated, the overriding effect of large volcanic eruptions appears to be a reduction of atmospheric CO2, presumably due to the dominance of associated cooling effects from clouds associated with volcanic gases/aerosols and volcanic debris.

(8) Since at least 1980 changes in global temperature, and presumably especially southern ocean temperature, appear to represent a major control on changes in atmospheric CO2.

Temperature-Change-Leads-CO2-Growth-Change-Humulum-2013.jpg


SAGE Journals: Your gateway to world-class research journals

CLIP: “[T]he warming and cooling of the ocean waters control how much CO2 is exchanged with atmosphere and thereby controlling the concentration of atmospheric CO2. It is obvious that when the oceans are cooled, in this case due to volcanic eruptions or La Niña events, they release less CO2 and when it was an extremely warm year, due to an El Niño, the oceans release more CO2. [D]uring the measured time 1979 to 2006 there has been a continued natural increase in temperature causing a continued increase of CO2 released into the atmosphere. This implies that temperature variations caused by El Niños, La Niñas, volcanic eruptions, varying cloud formations and ultimately the varying solar irradiation control the amount of CO2 which is leaving or being absorbed by the oceans.”


https://pubs.acs.org/doi/abs/10.1021/ef800581r

CLIP: “[With the short (5−15 year) RT [residence time] results shown to be in quasi-equilibrium, this then supports the (independently based) conclusion that the long-term (∼100 year) rising atmospheric CO2 concentration is not from anthropogenic sources but, in accordance with conclusions from other studies, is most likely the outcome of the rising atmospheric temperature, which is due to other natural factors. This further supports the conclusion that global warming is not anthropogenically driven as an outcome of combustion.”


Error - Cookies Turned Off

“[T]he trend in the airborne fraction [ratio of CO2 accumulating in the atmosphere to the CO2 flux into the atmosphere due to human activity] since 1850 has been 0.7 ± 1.4% per decade, i.e. close to and not significantly different from zero. The analysis further shows that the statistical model of a constant airborne fraction agrees best with the available data if emissions from land use change are scaled down to 82% or less of their original estimates. Despite the predictions of coupled climate-carbon cycle models, no trend in the airborne fraction can be found.”

Like it or not, that last sentence means that there simply is not a discernible trend in the percentage of atmospheric CO2 that can be linked to our emissions...that is because in the grand scheme of things, the amount of CO2 that we produce is very small...not even enough to have any measurable effect on the year to year variation of the earth's own CO2 making processes...

Here is a paper from James Hansen himself...the father of global warming and the high priest of anthropogenic climate change...

Climate forcing growth rates: doubling down on our Faustian bargain - IOPscience

CLIP: “However, it is the dependence of the airborne fraction on fossil fuel emission rate that makes the post-2000 downturn of the airborne fraction particularly striking. The change of emission rate in 2000 from 1.5% yr-1 [1960-2000] to 3.1% yr-1 [2000-2011], other things being equal, would [should] have caused a sharp increase of the airborne fraction”

erl459410f3_online.jpg


Even someone who can't read a graph should be able to look at that one produced by hansen and see that the amount of CO2 in the atmosphere simply does not track with the amount of CO2 that we produce.

Here is yet another very recently paper published in Earth Sciences that finds that our contribution to the total amount of CO2 in the atmosphere is vanishingly small...natural factors completely overwhelm our relatively minuscule CO2 production..

What Humans Contribute to Atmospheric CO<sub>2</sub>: Comparison of Carbon Cycle Models with Observations :: Science Publishing Group

Abstract:
The Intergovernmental Panel on Climate Change assumes that the inclining atmospheric CO2 concentration over recent years was almost exclusively determined by anthropogenic emissions, and this increase is made responsible for the rising temperature over the Industrial Era. Due to the far reaching consequences of this assertion, in this contribution we critically scrutinize different carbon cycle models and compare them with observations. We further contrast them with an alternative concept, which also includes temperature dependent natural emission and absorption with an uptake rate scaling proportional with the CO2 concentration. We show that this approach is in agreement with all observations, and under this premise not really human activities are responsible for the observed CO2increase and the expected temperature rise in the atmosphere, but just opposite the temperature itself dominantly controls the CO2 increase. Therefore, not CO2 but primarily native impacts are responsible for any observed climate changes.”

That paper expands on this paper which was published in the Journal of Global and Planetary Climate Change:

Scrutinizing the carbon cycle and CO2 residence time in the atmosphere - ScienceDirect


Do these qualify as verifiable facts?

There are some verifiable facts there and some model output...do they in any way demonstrate that our CO2 production is in any way altering the global climate? Not a chance. Like I said, it is always interesting to see what passes for evidence in the minds of alarmists. You have a few facts such as an increase in atmospheric CO2 which is real and verifiable...but then you hang a big assed, unsupportable assumption, and wild assed guesses on that fact suggesting that because CO2 is increasing, that we are responsible for the increase, and that the increase is causing warming...

The hard fact is that if CO2 were, in fact, capable of trapping heat in the atmosphere, there would be a tropospheric hot spot, and the total outgoing long wave radiation at the top of the atmosphere would be decreasing...again, print out the graphs from the study you provided and look at the actual measurements of outgoing long wave radiation at the top of the atmosphere...overlay the graphs and you can see that there is no change between 1970 and 2006...that is why that study never went anywhere...it didn't show what was being claimed...the only differences it showed was the difference between the model projections and the actual observations by the satellites....there was no difference in the outgoing LW in the CO2 wavelengths...

The climate models predict a tropospheric hot spot due to energy being trapped in the atmosphere by greenhouse gasses...here is a contrast between what the models predict and what we actually observe.. As you can see...there is no hot spot because there is no energy being trapped within the atmosphere...

Hot_spot.jpg


In order for that hot spot to exist, the amount of long wave radiation exiting at the top of the atmosphere would have to decrease...here are some observations of outgoing long wave radiation..as you can see, the amount of long wave exiting at the top of the atmosphere is increasing...therefore, no hot spot because CO2 is simply not capable of "trapping" anything at atmospheric pressures and temperatures.

Outgoing-long-wave-radiation-NOAA-520x304.jpg


You are letting journalists in the news media, politicians and self described climate activists tell you what the science says and are not verifying the truthfulness of what they are telling you either because you don't care, or because you don't believe you have enough education to understand the relatively simple science associated with climate...

Maybe you aren't aware that climate science is a soft science as opposed to the hard sciences like physics, chemistry, engineering, geology, meteorology, astrophysics, etc. A graduate from one of the hard sciences with a BS degree could teach any course within a climate science degree up to and including the PhD level...whereas a PhD climate scientist would not be able to effectively teach even the 4000 level courses leading to a BS in one of the hard sciences and would be hopelessly lost trying to teach courses in a masters or PhD program.
They find that we don't even produce enough CO2 to overcome the natural variation from year to year in the earth's own CO2 making mechanisms
Yet you acknowledge that my posted source show a steady increase in CO2 levels and even acknowledge that CO2 levels are rising. This means you have to have another source of CO2 emissions besides man to account for the rise. Do you?


Still waiting on those links s0n....we are not in Starbucks.
ESRL Global Monitoring Division - Global Greenhouse Gas Reference Network
Third time I posted this one I think.

Lol....yeah but link posted isnt even in the ballpark for answering the question. In fact, ignores it entirely.

You're back to the science. You post up stuff that's established information. Still fails to answer the ?.......

Where is the science transcending beyond it's own field? Do you understand the question?

Definition of TRANSCEND

If you are in need of an analogy I can provide one.

The entire planet knows all the science on both sides. But public policy makers have routinely rejected AGW.....for 20 years now.

So.......where is the science mattering beyond the field of science?

Links please :113::113:
 
France record high temperatures are actually a good thing, because by French law, a woman can walk half naked in any park or street without violating some public order statue.

And French women are rarely fat.
 
I would avoid places like skeptical science if I were you...the fact is that climate science said that the tropospheric hot spot would be the smoking gun which proved man made climate change...then it didn't happen so they made a fallacious appeal to complexity.

Like I said, we know how much energy the sun puts out, but are just beginning the process of understanding how varying amounts of energy in particular wavelengths affect the climate...what you take to be a rational argument is in effect, nothing more than an unsupportable wild assed guess devised to detract from the deep embarrassment of hoping so badly for a tropospheric hot spot and then having it not show up.

Look...here is the bottom line. In real science, a hypothesis lives or dies based on how well it can predict what happens in the real world. In real science, one predictive failure is often enough to have a hypothesis tossed out in order to start work on a hypothesis that won't experience predictive failures. In all other cases, a predictive failure is sufficient reason to carefully examine the hypothesis, and make changes to see if it can be modified such that it no longer experiences predictive failures.

The radiative greenhouse effect has literally littered the scientific landscape with predictive failures over the past few decades....the sheer number of predictive failures is astounding and there have been no modifications to the hypothesis at all...the same failed physics are at work in the computer models that they originally began with.

In real science, a single predictive failure is sufficient to have a hypothesis tossed out or at the very least, undergo modification in an effort to make it more accurate....

And here is the bottom line...

In pseudoscience, any number of predictive failures are fine so long as the funding continues. Anyone, even a scientific illiterate should be able to grasp that simple fact and run with it. Do a google search and look at the plethora of predictive failures that the radiative greenhouse effect and its bastard stepchild AGW have experienced over the past few decades and ask yourself why any hypothesis that has experienced that much predictive failure has managed to hang around...then consider science vs pseudoscience.
Actually, predictive failures with highly complex data are to be expected. That's why models provide ranges.
https://www.ipcc.ch/site/assets/uploads/2018/02/WG1AR5_Chapter09_FINAL.pdf
Also, I find it insanely ironic that someone who is on record saying he doesn't care if a person subjects himself to peer review is criticizing my choice of sourcing.

Increasing the margin of error is not a satisfactory answer to predictive failure..especially regarding an entity as observable and measurable as the atmosphere and the movement of energy through it... Increasing the margin of error is only an admission that the hypothesis is fatally flawed...increasing the margin of error is only a means of life support for a failed hypothesis...in pseudoscience, any number of predictive failures are acceptable so long as the funding continues...
Increasing the margin of error is acknowledging that more research needs to be done. Not an indication that the research is flawed. Especially because no other decent hypothesis is put forth by anyone.

When predictions fail, it is nothing but an acknowledgement that the research, and the hypothesis are flawed.....where they correct, there wouldn't be predictive failures.

Actually the theory I provided you is far better than the radiative greenhouse effect...like I said, it not only predicts the temperature here without the need of any fudge factor, but accurately predicts the temperature of every planet in the solar system with an atmosphere...a feat that the greenhouse hypothesis can't even begin to accomplish...

Politicians and activists don't like it though because the composition of the atmosphere is mostly irrelevant...the temperature of any given planet is the product of incoming solar radiation, gravity and the density of the atmosphere...if CO2 can't be portrayed as a demon, imagine the political power and money that would evaporate almost immediately... The very fact that politics is so incestuously intertwined with climate science should raise red flags to any person with an critical thinking skills at all...
They didn't fail. Failing means there wrong. Falling within a margin of error is not being wrong. In fact, establishing that there are margins of error in measurements is one of the first lessons I had in my high school science class. As more information is gathered you can, and they have reduced the margin for error.
Dr Spencer and I disagree.... They failed spectacularly!

model emperical review failure.png


Worse yet are your AGW cult leaders who think as the divergence gets wider your confidence is above 95% for being right? This is the upside down world of AGW..

126 Climate models failed empirical review, without exception.
 
Still waiting on those links s0n....we are not in Starbucks.
ESRL Global Monitoring Division - Global Greenhouse Gas Reference Network
Third time I posted this one I think.

Obsolete, useless data...superceded by the billion dollar plus OCO-2 satellite which paints a far different picture than the manipulated, cherry picked data from ESRL..

Post it 3 more times...or 300...it is still going to be obsolete, cherry picked data contradicted by observed satellite data.
aHR0cDovL3d3dy5saXZlc2NpZW5jZS5jb20vaW1hZ2VzL2kvMDAwLzA3Mi84ODQvb3JpZ2luYWwvY2FyYm9uLWNvbmNlbnRyYXRpb24uanBn

Luckily for me, you were so friendly to post that data. Lowest end a few spots with 387 ppm. A far cry from the pre-industrial under 300 mark.

The industrial revolution began towards the end of the little ice age....the earth has been warming out of the little ice age ever since...warmer oceans, warmer land equals more outgassing and more efficient decay of organic materials both on land and in the oceans resulting in more CO2...all the available hard data show that increased CO2 is the result of warming...not the cause...this is a very simple concept to grasp and has shown itself to be accurate in ice core after ice core after ice core...one wonders why you deny this well known science in favor of pseudoscience.

And then there is the fact that the earth hasn't even warmed to the temperatures that existed prior to the onset of the little ice age....do you find it unusual that we wouldn't at least warm that far considering that the earth is in the process of exiting an ice age?
-Previous warming periods. I'm talking about coming out of actual interglacials have NEVER in the history of the known records caused an increase in CO2 levels to over 400ppm not even close.
Incorrrect;

First you must have the proper spatial resolution with which to make that comparison in your data sets. You do not have it. Look at the rise over the last 100 years in CO2. If we place it in proper context of a 1000 year data point plot (as most proxies data sets are) our current rise would be nonexistent. Dr Mann made this mistake in his hokey schtick fabrication. He tacked on the instrument record at 5 year point plots onto his 1000 year point plot. This is Deception!

There are high resolution data sets that show our planet routinely rises and falls 100 to 200ppm in short time spans of 100 years.
 
Last edited:
Actually, predictive failures with highly complex data are to be expected. That's why models provide ranges.
https://www.ipcc.ch/site/assets/uploads/2018/02/WG1AR5_Chapter09_FINAL.pdf
Also, I find it insanely ironic that someone who is on record saying he doesn't care if a person subjects himself to peer review is criticizing my choice of sourcing.

Increasing the margin of error is not a satisfactory answer to predictive failure..especially regarding an entity as observable and measurable as the atmosphere and the movement of energy through it... Increasing the margin of error is only an admission that the hypothesis is fatally flawed...increasing the margin of error is only a means of life support for a failed hypothesis...in pseudoscience, any number of predictive failures are acceptable so long as the funding continues...
Increasing the margin of error is acknowledging that more research needs to be done. Not an indication that the research is flawed. Especially because no other decent hypothesis is put forth by anyone.

When predictions fail, it is nothing but an acknowledgement that the research, and the hypothesis are flawed.....where they correct, there wouldn't be predictive failures.

Actually the theory I provided you is far better than the radiative greenhouse effect...like I said, it not only predicts the temperature here without the need of any fudge factor, but accurately predicts the temperature of every planet in the solar system with an atmosphere...a feat that the greenhouse hypothesis can't even begin to accomplish...

Politicians and activists don't like it though because the composition of the atmosphere is mostly irrelevant...the temperature of any given planet is the product of incoming solar radiation, gravity and the density of the atmosphere...if CO2 can't be portrayed as a demon, imagine the political power and money that would evaporate almost immediately... The very fact that politics is so incestuously intertwined with climate science should raise red flags to any person with an critical thinking skills at all...
They didn't fail. Failing means there wrong. Falling within a margin of error is not being wrong. In fact, establishing that there are margins of error in measurements is one of the first lessons I had in my high school science class. As more information is gathered you can, and they have reduced the margin for error.
Dr Spencer and I disagree.... They failed spectacularly!

View attachment 267858

Worse yet are your AGW cult leaders who think as the divergence gets wider your confidence is above 95% for being right? This is the upside down world of AGW..

126 Climate models failed empirical review, without exception.

Holy crap Billy.....what a bunch of hooey from these frauds.
 

Obsolete, useless data...superceded by the billion dollar plus OCO-2 satellite which paints a far different picture than the manipulated, cherry picked data from ESRL..

Post it 3 more times...or 300...it is still going to be obsolete, cherry picked data contradicted by observed satellite data.
aHR0cDovL3d3dy5saXZlc2NpZW5jZS5jb20vaW1hZ2VzL2kvMDAwLzA3Mi84ODQvb3JpZ2luYWwvY2FyYm9uLWNvbmNlbnRyYXRpb24uanBn

Luckily for me, you were so friendly to post that data. Lowest end a few spots with 387 ppm. A far cry from the pre-industrial under 300 mark.

The industrial revolution began towards the end of the little ice age....the earth has been warming out of the little ice age ever since...warmer oceans, warmer land equals more outgassing and more efficient decay of organic materials both on land and in the 8oceans resulting in more CO2...all the available hard data show that increased CO2 is the result of warming...not the cause...this is a very simple concept to grasp and has shown itself to be accurate in ice core after ice core after ice core...one wonders why you deny this well known science in favor of pseudoscience.

And then there is the fact that the earth hasn't even warmed to the temperatures that existed prior to the onset of the little ice age....do you find it unusual that we wouldn't at least warm that far considering that the earth is in the process of exiting an ice age?
-Previous warming periods. I'm talking about coming out of actual interglacials have NEVER in the history of the known records caused an increase in CO2 levels to over 400ppm not even close.
Incorrrect;

First you must have the proper spatial resolution with which to make that comparison in your data sets. You do not have it. Look at the rise over the last 100 years in CO2. If we place it in proper context of a 1000 year data point plot (as most proxies data sets are) our current rise would be nonexistent. Dr Mann made this mistake in his hokey schtick fabrication. He tacked on the instrument record at 5 year point plots onto his 1000 year point plot. This is Deception!

There are high resolution data sets that show our planet routinely rises and falls 100 to 200ppm in short time spans of 100 years.
You might be right. On that count. You might find evidence of sharp increases in a relatively short time. I can imagine super volcanoes being able to cause such a rise a short order. On the other hand I was claiming that 400 ppm wasn't even close to being reached in the ice core record. Not that sharp increases are unprecedented And since it's safe to assume that any agent can or mechanism other than man capable of increasing CO2 levels to such an extent. Would be an agent easily noticed by modern scientific equipment. Since no such agent or mechanism has been found man made global warming is the only theory that makes sense.
 
Last edited:
You might be right. On that count. You might find evidence of sharp increases in a relatively short time. I can imagine super volcanoes being able to cause such a rise a short order. On the other hand I was claiming that 400 ppm wasn't even close to being reached in the ice core record.

On that count, you are incorrect as well. So it goes when you depend on the media, politicians and activists for their interpretation of the science. The science of climate really isn't that difficult and you would benefit from taking the time to do your own checking if the truth holds any interest to you at all.

CO2 concentrations from ice core records have shown atmospheric CO2 concentrations ranging up to 700 ppm during the early Holocene. Selection bias resulted in those numbers being rejected after the early 1980's because they didn't fit the narrative.

http://21sci-tech.com/2006_articles/IceCoreSprg97.pdf

Clip:
The ice core data from various polar sites are not consistent with each another, and there is a discrepancy between these data and geological climatic evidence.12 One such example is the discrepancy between the classic Antarctic Byrd and Vostok ice cores, where an important decrease in the CO2 content in the air bubbles occurred at the same depth of about 500 me- ters, but at which the ice age differed by about 16,000 years. In an approximately 14,000-year-old part of the Byrd core, a drop in the CO2 concentration of 50 ppmv was observed, but in similarly old ice from the Vostok core, an increase of 60 ppmv was found. In about ~6,000-year-old ice from Camp Century, Greenland, the CO2 concentration in air bubbles was 420 ppmv, but it was 270 ppmv in similarly old ice from Byrd, Antarctica.

Clip:
In the air from firn and ice at Summit, Greenland, deposited during the past ~200 years, the CO2 concentration ranged from 243.3 ppmv to 641.4 ppmv.21

Clip:
Until 1985, the published CO2 readings from air bubbles in pre-industrial ice ranged from 160 to about 700 ppmv, and oc- casionally even up to 2,450 ppmv. After 1985, high readings disappeared from the publications! To fit such a wide range of results to the anthropogenic climatic warming theory, which was based on low pre-industrial CO2 levels, three methods were used: (1) rejection of high readings from sets of pre- industrial samples, based on the credo: “The lowest CO2 val- ues best represent the CO2 concentrations in the originally trapped ice”;23 (2) rejection of low readings from sets of 20th century samples; and (3) interpretation of the high readings from pre-industrial samples as representing the contemporary atmosphere rather than the pre-industrial one.

Clip:
Neftel, et al. reported in 1982 rather high median CO2 concentrations in the preindustrial ice core from Byrd, Antarctica, of about 330 and 415 ppmv, with maximum value reaching 500 ppmv. However, in 1988, in the second publication on the same core, Neftel et al. did not show these high readings; the highest concentration reported was 290 ppmv, in agreement with the global warming theory.


Clip:
Pearman, et al. [1986] “on examination of the data,” rejected 43 percent of the CO2 readings from Law Dome, Antarctica core … because they were higher or lower than the assumed “correct” values. Thus, they concluded a value of 281 ppmv CO2 for the pre-industrial atmosphere.

Here is some more:

CLIMATIC CHANGES: ANTHROPOGENIC INFLUENCE OR NATURALLY INDUCED PHENOMENON | Foscolos | Bulletin of the Geological Society of Greece

Clip:
By the end of the 18th century eminent scientists explained the climatic changes on the basis of temperature and the ensuing glacial retreat. This disturbing observation led many prominent scientists to send air balloons equipped with special devices to trap air from the lower atmosphere in order to measure CO2 concentrations. Ninety thousand (90,000) measurements were carried out at 138 locations in 4 continents between 1810 and 1961. The data indicated that atmospheric CO2 concentrations, during the 19th century varied between 290 and 430 ppm


Again...because you don't delve into the science and trust the media, politicians, and activists to tell you what the science says, you are the victim of cherry picking the data to support a narrative. You only get the data that supports the alarmist narrative and believe that you are in possession of the whole story. The fact is that the science...the real science when looked at as a whole, rather than cherry picked vignettes selected to support a narrative simply doesn't support the AGW narrative.

Here is some more regarding the changes that have happened recently regarding thoughts on natural sources of CO2...

Long Invisible, Research Shows Volcanic CO2 Levels Are Staggering (Op-Ed)

Clip:
"In 1992 it was thought that that volcanic degassing released something like 100 million tons of CO2 each year. Around the turn of the millennium, this figure was getting closer to 200. The most recent estimate released this February comes from a team led by Mike Burton of the Italian National Institute of Geophysics and Volcanology - and it is just shy of 600 million tons. It caps a staggering trend: A six fold increase in just two decades.

I might note that that figure will continue to rise as undersea exploration continues....and with every rise found in natural sources, our contribution to the total diminishes... You are not being made aware of this sort of data by politicians, the media, and activists, because this sort of data doesn't fit the alarmist narrative...

And in the end, even though you are wrong about past CO2 concentrations, and what ice core data shows, and even man's contribution to the total CO2, it is moot because the fact remains that there isn't a shred of observed, measured evidence which supports the claim that increased CO2 in the atmosphere equals increased temperatures...the fact remains that all the hard data we possess shows us that increased atmospheric CO2 concentrations are the result of warming temperatures...not the cause.

There is little point in even discussing CO2 concentrations till such time as it is possible to demonstrate anywhere outside of a model that increased CO2 in the atmosphere equals warming..and the fact is that will never be demonstrated because it simply has no basis in reality.


On your author and his opinions: Zbigniew Jaworowski - Wikipedia

Climate change
Jaworowski's works on ice cores were published in Jaworowski (1994, 1992) and in reports Jaworowski (1990, 1992). Jaworowski has suggested that the long-term CO2 record is an artifact caused by the structural changes of the ice with depth and by postcoring processes.

However, Jaworowski's views are rejected by the scientific community.[citation needed] Increases in CO2 and CH4 concentrations in the Vostok core are similar for the last two glacial-interglacial transitions, even though only the most recent transition is located in the brittle zone. Such evidence argues that the atmospheric trace-gas signal is not strongly affected by the presence of the brittle zone.[4] Similarly Hans Oeschger[5] states that "...Some of (Jaworowski's) statements are drastically wrong from the physical point of view".

Opinions
Stephen Schneider said of him that "Jaworowski is perhaps even more contrarian than most, claiming that he can prove the climate is going to get colder through his work excavating glaciers on six different continents, which he says indicates what we should really be worrying about is 'The approaching new Ice Age...'."[2] Jaworowski wrote The current sunspot cycle is weaker than the preceding cycles, and the next two cycles will be even weaker. Bashkirtsev and Mishnich (2003)[6] expect that the minimum of the secular cycle of solar activity will occur between 2021 and 2026, which will result in the minimum global temperature of the surface air. The shift from warm to cool climate might have already started..

When approached to see if he would bet on future cooling, Jaworowski denied making any prediction, stating "I do not make my own detailed projections. In my paper I referred the reader to B&M paper, and that is all."[3]

Jaworowski published several papers[7][8][9][10] in 21st Century Science and Technology, a non-refereed magazine published by Lyndon LaRouche.[11]

Jaworowski has also written that the movement to remove lead from gasoline was based on a "stupid and fraudulent myth," and that lead levels in the human bloodstream are not significantly affected by the use of leaded gasoline. [4]
 
An opinion...a belief...no actual evidence...how completely unsurprising...

In which study or studies pray tell were published that rigorously demonstrated he was incorrect. What’s that? There were no studies. Thought so.
 
Would be an agent easily noticed by modern scientific equipment. Since no such agent or mechanism has been found man made global warming is the only theory that makes sense.
IN YOUR OPINION, one that I can disprove very easily. Its called our Oceans.

Our oceans can out gas very quickly when our sun warms them, biological matter increases in this warmth and the decay process is enhanced. This is why CO2 lags temperature rise in all cases. These two simple processes dwarf mans input by a factor of five on the low side of their mass. As we still do not know how to model this system properly and all modeling overstates the affect, its is highly probable mans impact is far less than 0.1 Deg C per doubling of CO2 as our atmosphere is acting in a dampening manner not an enhancing one like the AGW hypothesis purports.

CO2 and Ice Ages.JPG


You will note that CO2 lags all temperature change by 80-200 years.
 
Last edited:
It's still hotter than all its other measurements. So what's your problem?
News Flash! It gets hot in summer!
Hot in Alaska, too.

Alaska heat wave: Coldest state could see all-time record today

LOL....

Another 50 year long record on a 4.5 billion year old planet... The entire record is on the solar up swing and now a La Niña flow pattern which is always warmer in summer. In the grand empirical length of paleo records this is not an uncommon occurrence....

Why do the AGW nutters always go breathless over a regional event that doesn't mean squat? How breathless will they be when we start major low temp records in the NH in a few months?

Was the Anchorage all-time temperature record aided by airport growth?
 
Last edited:
Would be an agent easily noticed by modern scientific equipment. Since no such agent or mechanism has been found man made global warming is the only theory that makes sense.
IN YOUR OPINION, one that I can disprove very easily. Its called our Oceans.

Our oceans can out gas very quickly when our sun warms them, biological matter increases in this warmth and the decay process is enhanced. This is why CO2 lags temperature rise in all cases. These two simple processes dwarf mans input by a factor of five on the low side of their mass. As we still do not know how to model this system properly and all modeling overstates the affect, its is highly probable mans impact is far less than 0.1 Deg C per doubling of CO2 as our atmosphere is acting in a dampening manner not an enhancing one like the AGW hypothesis purports.

View attachment 267914

You will note that CO2 lags all temperature change by 80-200 years.

For some reason the attachment is not showing...
 

Attachments

  • CO2 and Ice Ages.JPG
    CO2 and Ice Ages.JPG
    68.5 KB · Views: 32

Forum List

Back
Top