SSDD
Gold Member
- Nov 6, 2012
- 16,672
- 1,966
- 280
ESRL Global Monitoring Division - Global Greenhouse Gas Reference NetworkNow as promised.
Hypothesis: Man is making the earth warmer by emitting CO2 in the atmosphere at an unsustainable rate.
-First, this means we have to establish that the earth's CO2 level is rising. I will suppose you don't challenge that CO2 is a greenhouse gas?
First, the scientific method demands that you establish that rising CO2 levels actually cause warming.. To date, there is no observed, measured evidence which establishes any coherent link between the absorption of infrared radiation by a gas and warming in the atmosphere. Do feel free to provide some if you think any exists. Without that, no amount of demonstration that CO2 levels are rising mean anything at all.
Thus far, I have provided 8 published studies that find that the atmospheric CO2 levels are rising but all find that we are not the ones driving the increase. They find that we don't even produce enough CO2 to overcome the natural variation from year to year in the earth's own CO2 making mechanisms...They find that rising CO2 levels are the result of warming..not the cause of it.
More of the same...published science finds that we are not the ones driving atmospheric CO2 levels...and then there is the issue with demonstrating a coherent relationship between the absorption of infrared radiation by a gas, and warming in the atmosphere.
That is a verifiable fact, isn't it?
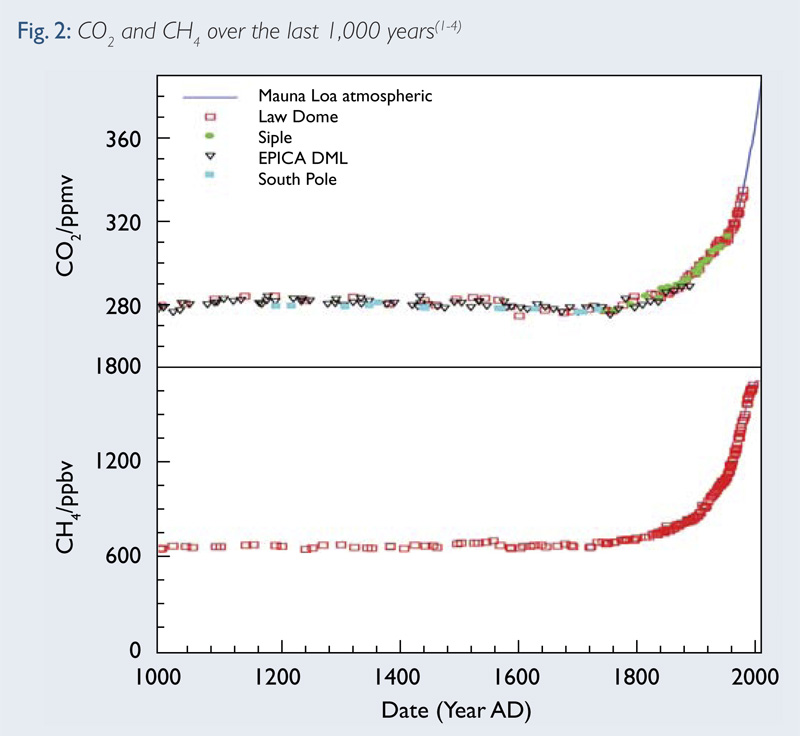
Of course...CO2 levels are greater now than they have been in the relatively recent past, but that doesn't mean anything...Hell, the present ice age began with atmospheric CO2 levels in the 1000ppm range compared to our 400ppm....like I said, I have provided ample published science that finds that we are not the ones driving atmospheric CO2 levels...and in fact, our contribution to CO2 levels is vanishingly small. And again, there is no observed, measured evidence that demonstrates that rising CO2 causes warming...all the observed evidence shows that increasing CO2 is the result of warming...not the cause
-Second, we need to establish that CO2 is trapping heat.
Good luck with that...if CO2 trapped heat, there would be an inevitable tropospheric hot spot...alas, no such hot spot exists.
Again...the key word there is inferred...not observed, not measured, not anything but inferred and that is 20 years out of date...the claim went nowhere because it simply wasn't supportable by the evidence.
Here are some of the graphs from that paper..
This first image shows outgoing long wave radiation at the top of the atmosphere in 1970 vs 1997 The dark line is the IMG data (from 1997), and the gray line is the IRIS line (from (1970). The 1997 OLR associated with CO2 is identical to that in 1970.

This next graph shows the OLR emission from TES (in 2006). The black line is the actual measurement data, the red line is what the climate models show, and the blue line is the difference between the actual and model data.

This last graph shows the OLR emission from IMG (1997). Just like the previous figure, the black line is the actual measurement data, the red line is what the climate models show, and the blue line is the difference between actual and model data.

Print out the TES image showing the outgoing long wave in 2006 and the IRIS image showing outgoing long wave in 1970 and overlay them...they are identical in the CO2 wavelengths.
There is a reason that the study went nowhere....it didn't make the case.
This shows 2 different IR satellites showing a steady drop in radiation going out at the wavelengths of CO2.
Again verifiable.
Sorry guy....it shows nothing of the sort...print out the graphs and overlay them...no change in the outgoing long wave in the CO2 wavelengths between 1970 and 2006 in spite of considerable increases in atmospheric CO2.
Again...if CO2 were trapping energy, there would be an investable hot spot in the upper troposphere...no such hot spot exists...
P1.7 Measurements of the Radiative Surface Forcing of Climate (2006 - Annual2006_18climatevari)
This shows an analysis of high-resolution spectral data from the surface and isolates the different greenhouse gasses.
A fine example of being fooled by instrumentation...the instruments they are using are cooled to a temperature of roughly -80F....they are not measuring energy moving from the cooler atmosphere to the warmer earth...they are measuring energy moving from the warmer atmosphere to the cooler instrument...place another identical instrument except uncooled next to the cooled one, and you won't measure any downdwelling radiation. The second law of thermodynamics says that it is not possible for energy to move from a cooler region to a warmer region without some work having been done to make that energy movement possible.
Second Law of Thermodynamics: It is not possible for heat to flow from a colder body to a warmer body without any work having been done to accomplish this flow. Energy will not flow spontaneously from a low temperature object to a higher temperature object.
Error - Cookies Turned Off
This one is a study of heat buildup.
That is nothing but the output of models...failing models I might add...no empirical evidence there
-Lastly, we have to establish that humans are the cause of this rise in CO2.
U.S. Energy Information Administration (EIA) - Total Energy Annual Data
Here you see a precise calculation of all energy sources in the US similar information exists by nation.
I am not sure where you believe there is any empirical data demonstrating or establishing that we are the cause of the rise in CO2. All that shows is that humans produce CO2 and that different countries produce different amounts...all of our CO2 combined isn't even as much as termites make...Like I said, we don't produce enough CO2 to even overcome the natural variation from year to year in the earth's own CO2 making mechanism.
Here are several peer reviewed, published studies which show very clearly that our effect on the total atmospheric CO2 is largely unmeasurable.. human beings, with all our CO2 producing capacity don't even make enough CO2 to overcome the year to year variation in the earth's own CO2 making machinery...
The fact is that the amount of CO2 we produce from year to year does not track with the amount of increase in atmospheric CO2.
https://www.researchgate.net/public...SPHERIC_CO2_TO_ANTHROPOGENIC_EMISSIONS_A_NOTE
CLIP: “A necessary condition for the theory of anthropogenic global warming is that there should be a close correlation between annual fluctuations of atmospheric CO2 and the annual rate of anthropogenic CO2 emissions. Data on atmospheric CO2 and anthropogenic emissions provided by the Mauna Loa measuring station and the CDIAC in the period 1959-2011 were studied using detrended correlation analysis to determine whether, net of their common long term upward trends, the rate of change in atmospheric CO2 is responsive to the rate of anthropogenic emissions in a shorter time scale from year to year. … [R]esults do not indicate a measurable year to year effect of annual anthropogenic emissions on the annual rate of CO2 accumulation in the atmosphere.”
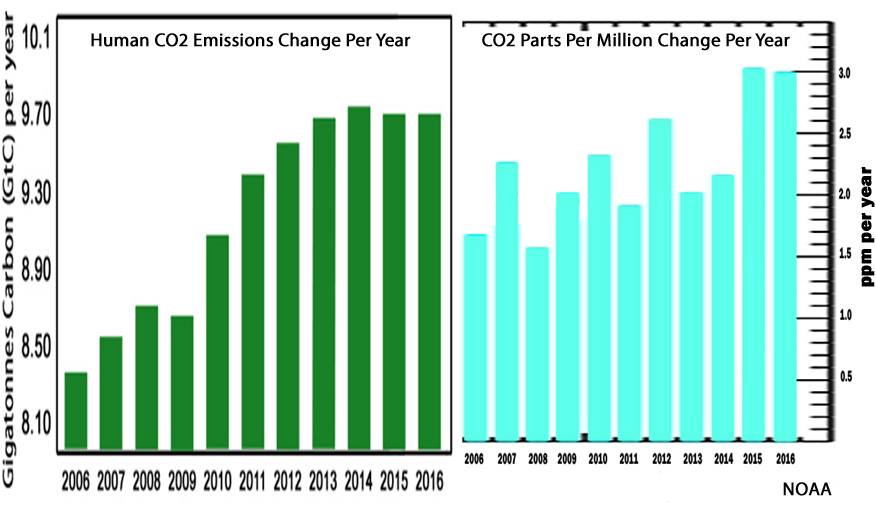
If you look at the graph...assuming that you can read a graph...you will see for example, that there was a rise in our emissions between 2007 and 2008 but a significant decline in the atmospheric CO2 concentration. Do you believe that human CO2 went somewhere to hide and waited around for some years before it decided to have an effect on the total atmospheric CO2 concentration? Then between 2008 and 2009, there was a decline in the amount of CO2 that humans emitted into the atmosphere, but a significant rise in the atmospheric CO2 concentration. Then from 2010 to 2014 there was a large rise in man made CO2 emissions but an overall flat to declining trend in the atmospheric CO2 concentration. Between 2014 to 2016 there was a slight decline in man made CO2 emissions, but a pronounced rise in the atmospheric CO2 concentrations. Like I said, we produce just a fraction of the natural variation in the earth's own CO2 making machinery from year to year and we are learning that we really don't even have a handle on how much CO2 the earth is producing...the undersea volcanoes are a prime example of how much we don't know.
https://www2.meteo.uni-bonn.de/bibliothek/Flohn_Publikationen/K287-K320_1981-1985/K299.pdf
CLIP: “The recent increase of the CO2-content of air varies distinctly from year to year, rather independent from the irregular annual increase of global CO2-production from fossil fuel and cement, which has since 1973 decreased from about 4.5 percent to 2.25 percent per year (Rotty 1981).”
“Comparative investigations (Keeling and Bacastow 1977, Newll et al. 1978, Angell 1981) found a positive correlation between the rate of increase of atmospheric CO2 and the fluctuations of sea surface temperature (SST) in the equatorial Pacific, which are caused by rather abrupt changes between upwelling cool water and downwelling warm water (“El Niño”) in the eastern equatorial Pacific. Indeed the cool upwelling water is not only rich in (anorganic) CO2 but also in nutrients and organisms. (algae) which consume much atmospheric CO2 in organic form, thus reducing the increase in atmospehreic CO2. Conversely the warm water of tropical oceans, with SST near 27°C, is barren, thus leading to a reduction of CO2 uptake by the ocean and greater increase of the CO2. … A crude estimate of these differences is demonstrated by the fact that during the period 1958-1974, the average CO2-increase within five selective years with prevailing cool water only 0.57 ppm/a [per year], while during five years with prevailing warm water it was 1.11 ppm/a. Thus in a a warm water year, more than one Gt (1015 g) carbon is additionally injected into the atmosphere, in comparison to a cold water year.”
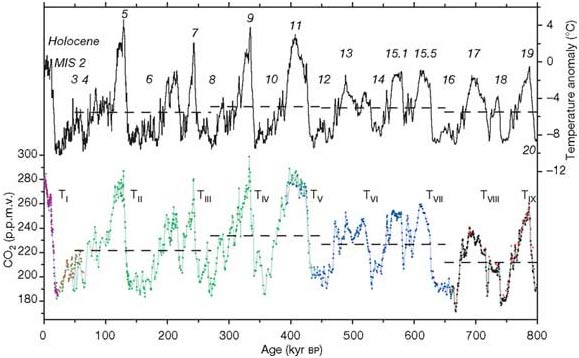
Practically every actual study ever done tells us that increases in CO2 follow increases in temperature...that means that increased CO2 is the result of increased temperature, not the cause of increased temperature...which makes sense since warm oceans hold less CO2 and as they warm, they outages CO2.
https://www.researchgate.net/public...spheric_carbon_dioxide_and_global_temperature
CLIP"
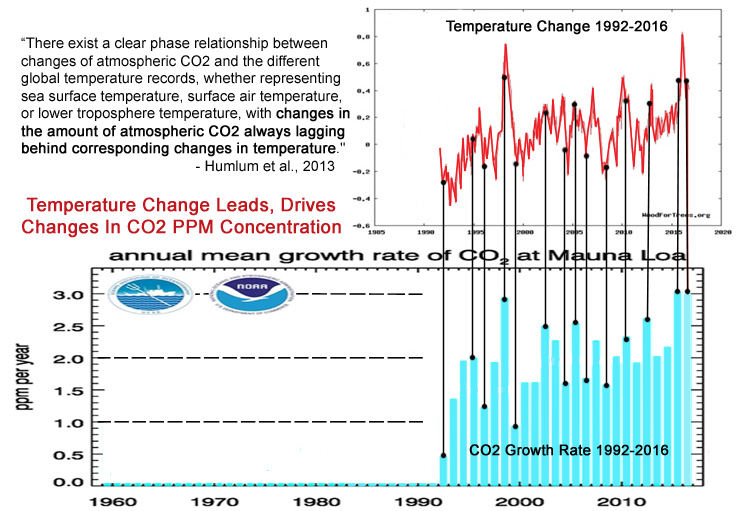
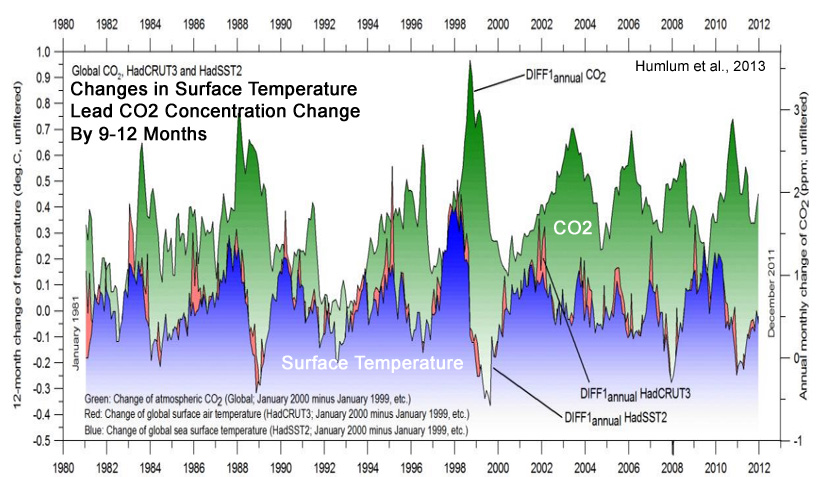
“There exist a clear phase relationship between changes of atmospheric CO2 and the different global temperature records, whether representing sea surface temperature, surface air temperature, or lower troposphere temperature, with changes in the amount of atmospheric CO2 always lagging behind corresponding changes in temperature.”
(1) The overall global temperature change sequence of events appears to be from 1) the ocean surface to 2) the land surface to 3) the lower troposphere.
(2) Changes in global atmospheric CO2 are lagging about 11–12 months behind changes in global sea surface temperature.
(3) Changes in global atmospheric CO2 are lagging 9.5–10 months behind changes in global air surface temperature.
(4) Changes in global atmospheric CO2 are lagging about 9 months behind changes in global lower troposphere temperature.
(5) Changes in ocean temperatures appear to explain a substantial part of the observed changes in atmospheric CO2 since January 1980.
(6) CO2 released from anthropogenic sources apparently has little influence on the observed changes in atmospheric CO2, and changes in atmospheric CO2 are not tracking changes in human emissions.
(7) On the time scale investigated, the overriding effect of large volcanic eruptions appears to be a reduction of atmospheric CO2, presumably due to the dominance of associated cooling effects from clouds associated with volcanic gases/aerosols and volcanic debris.
(8) Since at least 1980 changes in global temperature, and presumably especially southern ocean temperature, appear to represent a major control on changes in atmospheric CO2.
SAGE Journals: Your gateway to world-class research journals
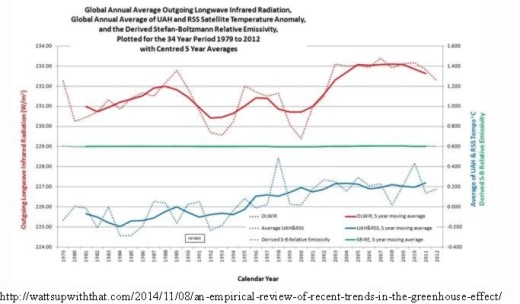
CLIP: “[T]he warming and cooling of the ocean waters control how much CO2 is exchanged with atmosphere and thereby controlling the concentration of atmospheric CO2. It is obvious that when the oceans are cooled, in this case due to volcanic eruptions or La Niña events, they release less CO2 and when it was an extremely warm year, due to an El Niño, the oceans release more CO2. [D]uring the measured time 1979 to 2006 there has been a continued natural increase in temperature causing a continued increase of CO2 released into the atmosphere. This implies that temperature variations caused by El Niños, La Niñas, volcanic eruptions, varying cloud formations and ultimately the varying solar irradiation control the amount of CO2 which is leaving or being absorbed by the oceans.”
https://pubs.acs.org/doi/abs/10.1021/ef800581r
CLIP: “[With the short (5−15 year) RT [residence time] results shown to be in quasi-equilibrium, this then supports the (independently based) conclusion that the long-term (∼100 year) rising atmospheric CO2 concentration is not from anthropogenic sources but, in accordance with conclusions from other studies, is most likely the outcome of the rising atmospheric temperature, which is due to other natural factors. This further supports the conclusion that global warming is not anthropogenically driven as an outcome of combustion.”
Error - Cookies Turned Off
“[T]he trend in the airborne fraction [ratio of CO2 accumulating in the atmosphere to the CO2 flux into the atmosphere due to human activity] since 1850 has been 0.7 ± 1.4% per decade, i.e. close to and not significantly different from zero. The analysis further shows that the statistical model of a constant airborne fraction agrees best with the available data if emissions from land use change are scaled down to 82% or less of their original estimates. Despite the predictions of coupled climate-carbon cycle models, no trend in the airborne fraction can be found.”
Like it or not, that last sentence means that there simply is not a discernible trend in the percentage of atmospheric CO2 that can be linked to our emissions...that is because in the grand scheme of things, the amount of CO2 that we produce is very small...not even enough to have any measurable effect on the year to year variation of the earth's own CO2 making processes...
Here is a paper from James Hansen himself...the father of global warming and the high priest of anthropogenic climate change...
Climate forcing growth rates: doubling down on our Faustian bargain - IOPscience
CLIP: “However, it is the dependence of the airborne fraction on fossil fuel emission rate that makes the post-2000 downturn of the airborne fraction particularly striking. The change of emission rate in 2000 from 1.5% yr-1 [1960-2000] to 3.1% yr-1 [2000-2011], other things being equal, would [should] have caused a sharp increase of the airborne fraction”

Even someone who can't read a graph should be able to look at that one produced by hansen and see that the amount of CO2 in the atmosphere simply does not track with the amount of CO2 that we produce.
Here is yet another very recently paper published in Earth Sciences that finds that our contribution to the total amount of CO2 in the atmosphere is vanishingly small...natural factors completely overwhelm our relatively minuscule CO2 production..
What Humans Contribute to Atmospheric CO<sub>2</sub>: Comparison of Carbon Cycle Models with Observations :: Science Publishing Group
Abstract:
The Intergovernmental Panel on Climate Change assumes that the inclining atmospheric CO2 concentration over recent years was almost exclusively determined by anthropogenic emissions, and this increase is made responsible for the rising temperature over the Industrial Era. Due to the far reaching consequences of this assertion, in this contribution we critically scrutinize different carbon cycle models and compare them with observations. We further contrast them with an alternative concept, which also includes temperature dependent natural emission and absorption with an uptake rate scaling proportional with the CO2 concentration. We show that this approach is in agreement with all observations, and under this premise not really human activities are responsible for the observed CO2increase and the expected temperature rise in the atmosphere, but just opposite the temperature itself dominantly controls the CO2 increase. Therefore, not CO2 but primarily native impacts are responsible for any observed climate changes.”
That paper expands on this paper which was published in the Journal of Global and Planetary Climate Change:
Scrutinizing the carbon cycle and CO2 residence time in the atmosphere - ScienceDirect
Do these qualify as verifiable facts?
There are some verifiable facts there and some model output...do they in any way demonstrate that our CO2 production is in any way altering the global climate? Not a chance. Like I said, it is always interesting to see what passes for evidence in the minds of alarmists. You have a few facts such as an increase in atmospheric CO2 which is real and verifiable...but then you hang a big assed, unsupportable assumption, and wild assed guesses on that fact suggesting that because CO2 is increasing, that we are responsible for the increase, and that the increase is causing warming...
The hard fact is that if CO2 were, in fact, capable of trapping heat in the atmosphere, there would be a tropospheric hot spot, and the total outgoing long wave radiation at the top of the atmosphere would be decreasing...again, print out the graphs from the study you provided and look at the actual measurements of outgoing long wave radiation at the top of the atmosphere...overlay the graphs and you can see that there is no change between 1970 and 2006...that is why that study never went anywhere...it didn't show what was being claimed...the only differences it showed was the difference between the model projections and the actual observations by the satellites....there was no difference in the outgoing LW in the CO2 wavelengths...
The climate models predict a tropospheric hot spot due to energy being trapped in the atmosphere by greenhouse gasses...here is a contrast between what the models predict and what we actually observe.. As you can see...there is no hot spot because there is no energy being trapped within the atmosphere...

In order for that hot spot to exist, the amount of long wave radiation exiting at the top of the atmosphere would have to decrease...here are some observations of outgoing long wave radiation..as you can see, the amount of long wave exiting at the top of the atmosphere is increasing...therefore, no hot spot because CO2 is simply not capable of "trapping" anything at atmospheric pressures and temperatures.
You are letting journalists in the news media, politicians and self described climate activists tell you what the science says and are not verifying the truthfulness of what they are telling you either because you don't care, or because you don't believe you have enough education to understand the relatively simple science associated with climate...
Maybe you aren't aware that climate science is a soft science as opposed to the hard sciences like physics, chemistry, engineering, geology, meteorology, astrophysics, etc. A graduate from one of the hard sciences with a BS degree could teach any course within a climate science degree up to and including the PhD level...whereas a PhD climate scientist would not be able to effectively teach even the 4000 level courses leading to a BS in one of the hard sciences and would be hopelessly lost trying to teach courses in a masters or PhD program.Yet you acknowledge that my posted source show a steady increase in CO2 levels and even acknowledge that CO2 levels are rising. This means you have to have another source of CO2 emissions besides man to account for the rise. Do you?They find that we don't even produce enough CO2 to overcome the natural variation from year to year in the earth's own CO2 making mechanisms
Still waiting on those links s0n....we are not in Starbucks.
Third time I posted this one I think.
Obsolete, useless data...superceded by the billion dollar plus OCO-2 satellite which paints a far different picture than the manipulated, cherry picked data from ESRL..
Post it 3 more times...or 300...it is still going to be obsolete, cherry picked data contradicted by observed satellite data.