
And yet the graph I presented shows that the Arctic ice was even lower in the 1970-71 time frame than it is now. Fully documented, but it exposes your lie for what it is, a lie.
Navigation
Install the app
How to install the app on iOS
Follow along with the video below to see how to install our site as a web app on your home screen.

Note: This feature currently requires accessing the site using the built-in Safari browser.
More options
You are using an out of date browser. It may not display this or other websites correctly.
You should upgrade or use an alternative browser.
You should upgrade or use an alternative browser.
Arctic Ice
- Thread starter Old Rocks
- Start date
Wyatt earp
Diamond Member
- Apr 21, 2012
- 69,975
- 16,383
- 2,180
It looks like we are headed for another very low ice cover in the Arctic this summer.
Arctic Sea Ice News & Analysis
Conditions in context
Although the 2009 melt season started slowly, the pace of ice loss quickened through May. During May, the Arctic Ocean lost 1.67 million square kilometers (645,000 square miles) of ice, an average decline of 54,000 square kilometers (21,000 square miles) per day. This is similar to the rate of decline observed last year. For comparison, the long-term average (1979-2000) rate of decline for May is 47,000 kilometers per day (18,000 square miles per day). By the end of May 2009, ice extent was 84,000 square kilometers (32,000 square miles) higher than extent at the end of May 2007.
About time, those mile high glaciers in Illinois made it a bitch to go to work a few million years ago. ...
Old Rocks
Diamond Member
- Thread starter
- #263
No, it does not. It shows a small percentage of ice north of Canada.And yet the graph I presented shows that the Arctic ice was even lower in the 1970-71 time frame than it is now. Fully documented, but it exposes your lie for what it is, a lie.
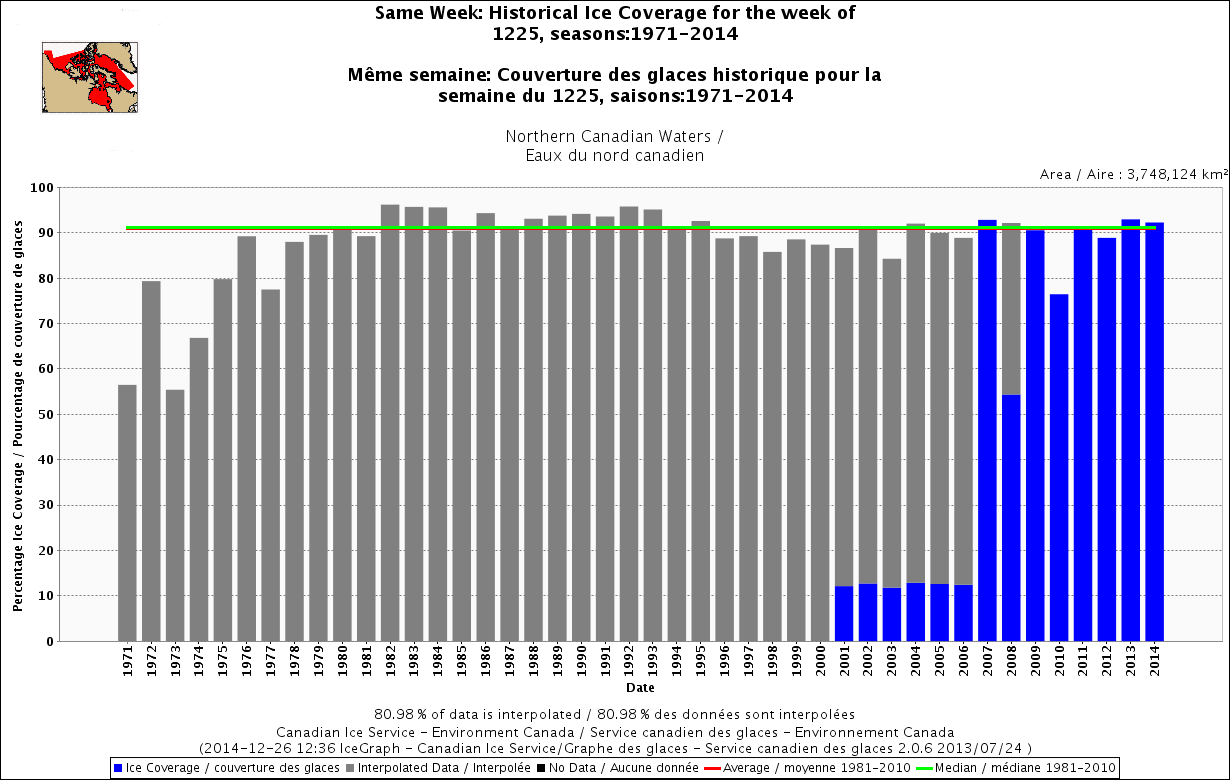
The little picture in the upper left hand corner of the graph shows the area that graph covers. Not a major portion of the Arctic Ice. You continue to push a lie.
No, it does not. It shows a small percentage of ice north of Canada.And yet the graph I presented shows that the Arctic ice was even lower in the 1970-71 time frame than it is now. Fully documented, but it exposes your lie for what it is, a lie.
The little picture in the upper left hand corner of the graph shows the area that graph covers. Not a major portion of the Arctic Ice. You continue to push a lie.
But it is the most variable depending on the temps and the wind. It is an excellent proxy for the conditions throughout the Arctic. Kind of like how manns proxy's are supposed to be so useful to determine the global temp, only he used but a single tree, while this is a quite large region of the Arctic. In other words olfraud, you fail, yet again.
Here is that thumbnail in the upper left:No, it does not. It shows a small percentage of ice north of Canada.And yet the graph I presented shows that the Arctic ice was even lower in the 1970-71 time frame than it is now. Fully documented, but it exposes your lie for what it is, a lie.
The little picture in the upper left hand corner of the graph shows the area that graph covers. Not a major portion of the Arctic Ice. You continue to push a lie.
The white portions are 10/10 ice cover.
Do you actually believe that there is abruptly any less ice in the area lat 70N -long60W which Environment Canada did not survey?
One thing is for sure, the NW passage was not navigable without using ice breakers and even the Nares Straight between Ellesmere Island and Greenland was still frozen. Many times in the past it's open at that time.
The Hudson Bay ice cover is also perfectly normal for July and matter of fact this is mentioned here:
Hudson Bay Sea Ice Highest Since 1992 | The Global Warming Policy Forum (GWPF)
We are seeing one of the extremes in Hudson Bay sea ice variability this year, not only in extent but in distribution of ice. Ice coverage on Hudson Bay this year at 28 July was twice what it was in 2009, the last “late” ice breakup year for which detailed ice maps are available (409 vs. 204 thousand km2), according to NSIDC MASIE ice maps. Canadian Ice Service data show 2015 coverage for the week of 30 July was the highest since 1992.
The odd pattern of ice distribution presents a conundrum. Have a look at the maps and graphs below.
The amount of sea ice left on Hudson Bay this year is comparable overall to the “good old days” (before every early breakup year was blamed on man-made global warming)
RollingThunder
Gold Member
- Mar 22, 2010
- 4,818
- 522
- 155
In the real world, this video graphic accurately represents the amount Arctic sea ice that has been lost in just the last three decades.
PIOMAS sea ice volume minimum - credit: Andy Lee Robinson
PIOMAS sea ice volume minimum - credit: Andy Lee Robinson
Old Rocks
Diamond Member
- Thread starter
- #267

Sea Ice : Feature Articles
The largest loss of sea ice is north of Siberia and Alaska. The area shown on that map retains a much higher percentage of ice due to ocean currents. You can readily see that on this map from last year.
Sea Ice : Feature Articles
The largest loss of sea ice is north of Siberia and Alaska. The area shown on that map retains a much higher percentage of ice due to ocean currents. You can readily see that on this map from last year.
Wow. Would you look at that! There's STILL ice up there. So....when is it going to go away? So far I think there have been 2 or 3 different years that have come and gone where the ice was going to be gone....and still it is there.....laughing at you!
Old Rocks
Diamond Member
- Thread starter
- #269
Pretty sad commentary, Mr. Westwall. After all, you are the fellow that has continually predicted a major cooling, and it has just continued to get warmer. And, yes, there was still some ice last summer. But a 1000 passenger luxury cruise transited the Northwest Passage, and the Northeast Passage was also open.
And this year we are starting with the least ice at the maximum that we have ever seen at this time of year in the Arctic. And the same for the Antarctic, except it is the least they have ever seen at their low extent. And remains way below two standard deviations from the norm.
And this year we are starting with the least ice at the maximum that we have ever seen at this time of year in the Arctic. And the same for the Antarctic, except it is the least they have ever seen at their low extent. And remains way below two standard deviations from the norm.
Pretty sad commentary, Mr. Westwall. After all, you are the fellow that has continually predicted a major cooling, and it has just continued to get warmer. And, yes, there was still some ice last summer. But a 1000 passenger luxury cruise transited the Northwest Passage, and the Northeast Passage was also open.
And this year we are starting with the least ice at the maximum that we have ever seen at this time of year in the Arctic. And the same for the Antarctic, except it is the least they have ever seen at their low extent. And remains way below two standard deviations from the norm.
No, it will be getting cooler. Falsified, and massaged "data" don't count when you claim that the last year was the "warmest evah!" The facts are that the world has not warmed over the last 20 years. It is poised to experience a major drop in global temps as the Sun go's quiet. That is a fact. In another three years or so it will be so obvious that the world is getting colder that no amount of BS lies will be able to cover for your failed theory.
SSDD
Gold Member
- Nov 6, 2012
- 16,672
- 1,966
- 280
Pretty sad commentary, Mr. Westwall. After all, you are the fellow that has continually predicted a major cooling, and it has just continued to get warmer. And, yes, there was still some ice last summer. But a 1000 passenger luxury cruise transited the Northwest Passage, and the Northeast Passage was also open.
Actually, it hasn't continued to get warmer...just more fake science and fake news...it hasn't warmed in a couple of decades...
And as to the northwest passage, it has been open for most of the past 10,000 years. This gold standard arctic temperature reconstruction derived from ice cores taken above the arctic circle clearly shows that for most of the past 10,000 years, it has been considerably warmer than it is now. It also shows periods of temperature change far in excess of anything we have seen in much shorter periods of time...
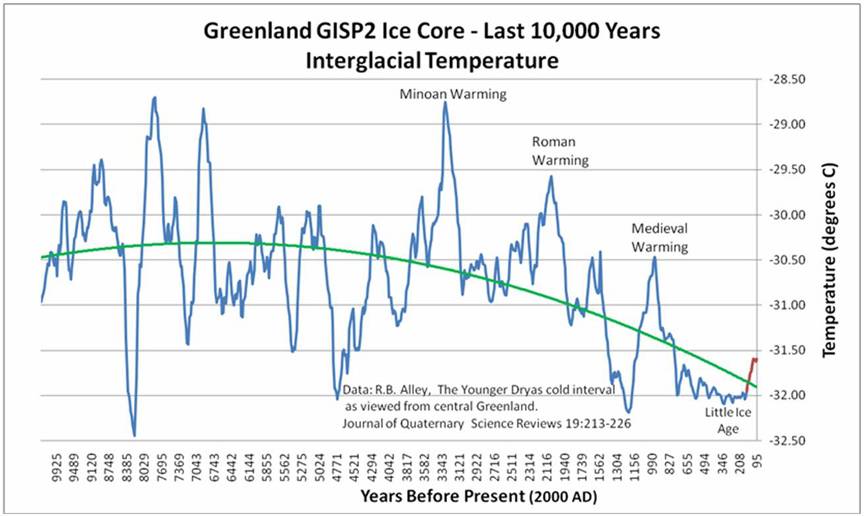
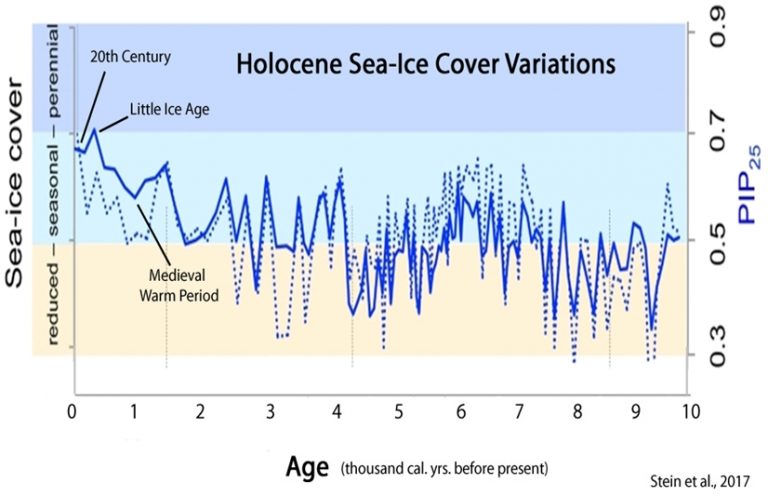
You have shown some graphs produced by pseudoscientists producing fake science for the fake news claiming ice has been greater during that period, but they fly in the face of that gold standard temperature reconstruction...the graph below is of more recent vintage and correlates nicely with the GOLD STANDARD temperature reconstruction and shows that the volume of ice at present far far far exceeds the volume of ice the arctic has had for the majority of the past 10,000 years...it also shows quite clearly that the amount and rate of change the arctic has seen in the past far exceeds anything we have seen placing what slight warming there has been well within the bounds of natural variability...your claims of CO2 fueled disaster are just fake news supporting fake science...its all fake all the time with you rocks.
And this year we are starting with the least ice at the maximum that we have ever seen at this time of year in the Arctic. And the same for the Antarctic, except it is the least they have ever seen at their low extent. And remains way below two standard deviations from the norm.[/QUOTE]
Old Rocks
Diamond Member
- Thread starter
- #272
LOL We have heard this song and dance from you before. And all it has done is warm. And it will continue to warm. And you will continue to lie about that warming. LOLPretty sad commentary, Mr. Westwall. After all, you are the fellow that has continually predicted a major cooling, and it has just continued to get warmer. And, yes, there was still some ice last summer. But a 1000 passenger luxury cruise transited the Northwest Passage, and the Northeast Passage was also open.
And this year we are starting with the least ice at the maximum that we have ever seen at this time of year in the Arctic. And the same for the Antarctic, except it is the least they have ever seen at their low extent. And remains way below two standard deviations from the norm.
No, it will be getting cooler. Falsified, and massaged "data" don't count when you claim that the last year was the "warmest evah!" The facts are that the world has not warmed over the last 20 years. It is poised to experience a major drop in global temps as the Sun go's quiet. That is a fact. In another three years or so it will be so obvious that the world is getting colder that no amount of BS lies will be able to cover for your failed theory.
RollingThunder
Gold Member
- Mar 22, 2010
- 4,818
- 522
- 155
Sea Ice : Feature Articles
The largest loss of sea ice is north of Siberia and Alaska. The area shown on that map retains a much higher percentage of ice due to ocean currents. You can readily see that on this map from last year.
Wow. Would you look at that! There's STILL ice up there. So....when is it going to go away? So far I think there have been 2 or 3 different years that have come and gone where the ice was going to be gone....and still it is there.....laughing at you!
It is only in your fraudulent, deliberately deceptive denier cult mythologies that "there have been 2 or 3 different years that have come and gone where the ice was going to be gone".
In the real world, not too many years ago, the consensus among climate scientists studying the Arctic was that it might take until 2100 for the Arctic to be ice free in the summers.....now, after watching the unexpected speed at which the ice cap is melting, most of these scientists are saying that it will probably be ice free by 2030 or possibly sooner. It has never been the scientific consensus that the north polar ice would all be melted by now.
The world is laughing at you anti-science, reality-challenged denier cult nutjobs.
SSDD
Gold Member
- Nov 6, 2012
- 16,672
- 1,966
- 280
LOL We have heard this song and dance from you before. And all it has done is warm. And it will continue to warm. And you will continue to lie about that warming. LOL
Sorry rocks....the only place it is warming is in computer models...and tortured data records....and I damned well hope it continues to warm...cold is the killer...not warmth.
RollingThunder
Gold Member
- Mar 22, 2010
- 4,818
- 522
- 155
LOL We have heard this song and dance from you before. And all it has done is warm. And it will continue to warm. And you will continue to lie about that warming. LOL
Sorry rocks....the only place it is warming is in computer models...and tortured data records....and I damned well hope it continues to warm...cold is the killer...not warmth.
You are either a paid troll pushing bullshit for money, or you are an insane retard, completely lost in a delusional rightwingnut fantasy world full of crackpot conspiracy theories, SSoooDDumb. Nobody with even half a brain can honestly look at the evidence and then say that kind of wacko nonsense.
SSDD
Gold Member
- Nov 6, 2012
- 16,672
- 1,966
- 280
You are either a paid troll pushing bullshit for money, or you are an insane retard, completely lost in a delusional rightwingnut fantasy world full of crackpot conspiracy theories, SSoooDDumb. Nobody with even half a brain can honestly look at the evidence and then say that kind of wacko nonsense.
Nope...I am just a guy who doesn't believe bullshit promoted without the first shred of actual evidence...you, on the other hand, described yourself to a T.
And I would suggest that you believe that bullshit precisely because you only have half a brain.
That's why these boat loads of idiots get stuck in the ice on their global warming cruises.
Sea Ice : Feature Articles
The largest loss of sea ice is north of Siberia and Alaska. The area shown on that map retains a much higher percentage of ice due to ocean currents. You can readily see that on this map from last year.
Wow. Would you look at that! There's STILL ice up there. So....when is it going to go away? So far I think there have been 2 or 3 different years that have come and gone where the ice was going to be gone....and still it is there.....laughing at you!
They figure these pictures are satellite images instead of computer generated color coded graphics.
It's happening at both poles and on occasion even ice breakers got stuck in the non-existing ice.
Old Rocks
Diamond Member
- Thread starter
- #278
You go where the ice is, you take the chance of getting stuck. Which has nothing at all to do with the fact that Mr. Westwall presented a map and graph and tried to claim the graph represented the whole of the Arctic. He is a liar, do you intend to repeat his lies?
How was he lying? It was not the whole arctic but did show the part you keep harping on.You go where the ice is, you take the chance of getting stuck. Which has nothing at all to do with the fact that Mr. Westwall presented a map and graph and tried to claim the graph represented the whole of the Arctic. He is a liar, do you intend to repeat his lies?
The stuff you keep posting are not maps. They are washed data reprocessed into color coded gifs & jpegs.
In the process the sat radar scan return is stuffed into arbitrary categories which clips off everything below 15% and for everything above 100% ice cover it uses an average thickness.
Then they proceed and morph that amputation into a total ice volume, these ridiculous spaghetti graphs you keep posting
Reality looks a lot different from these graphs and digital art pictures:
Last edited:
RollingThunder
Gold Member
- Mar 22, 2010
- 4,818
- 522
- 155
In the real world....here is NASA's satellite photography.....actual photographic evidence.


This image shows the multiyear sea ice in 1980.
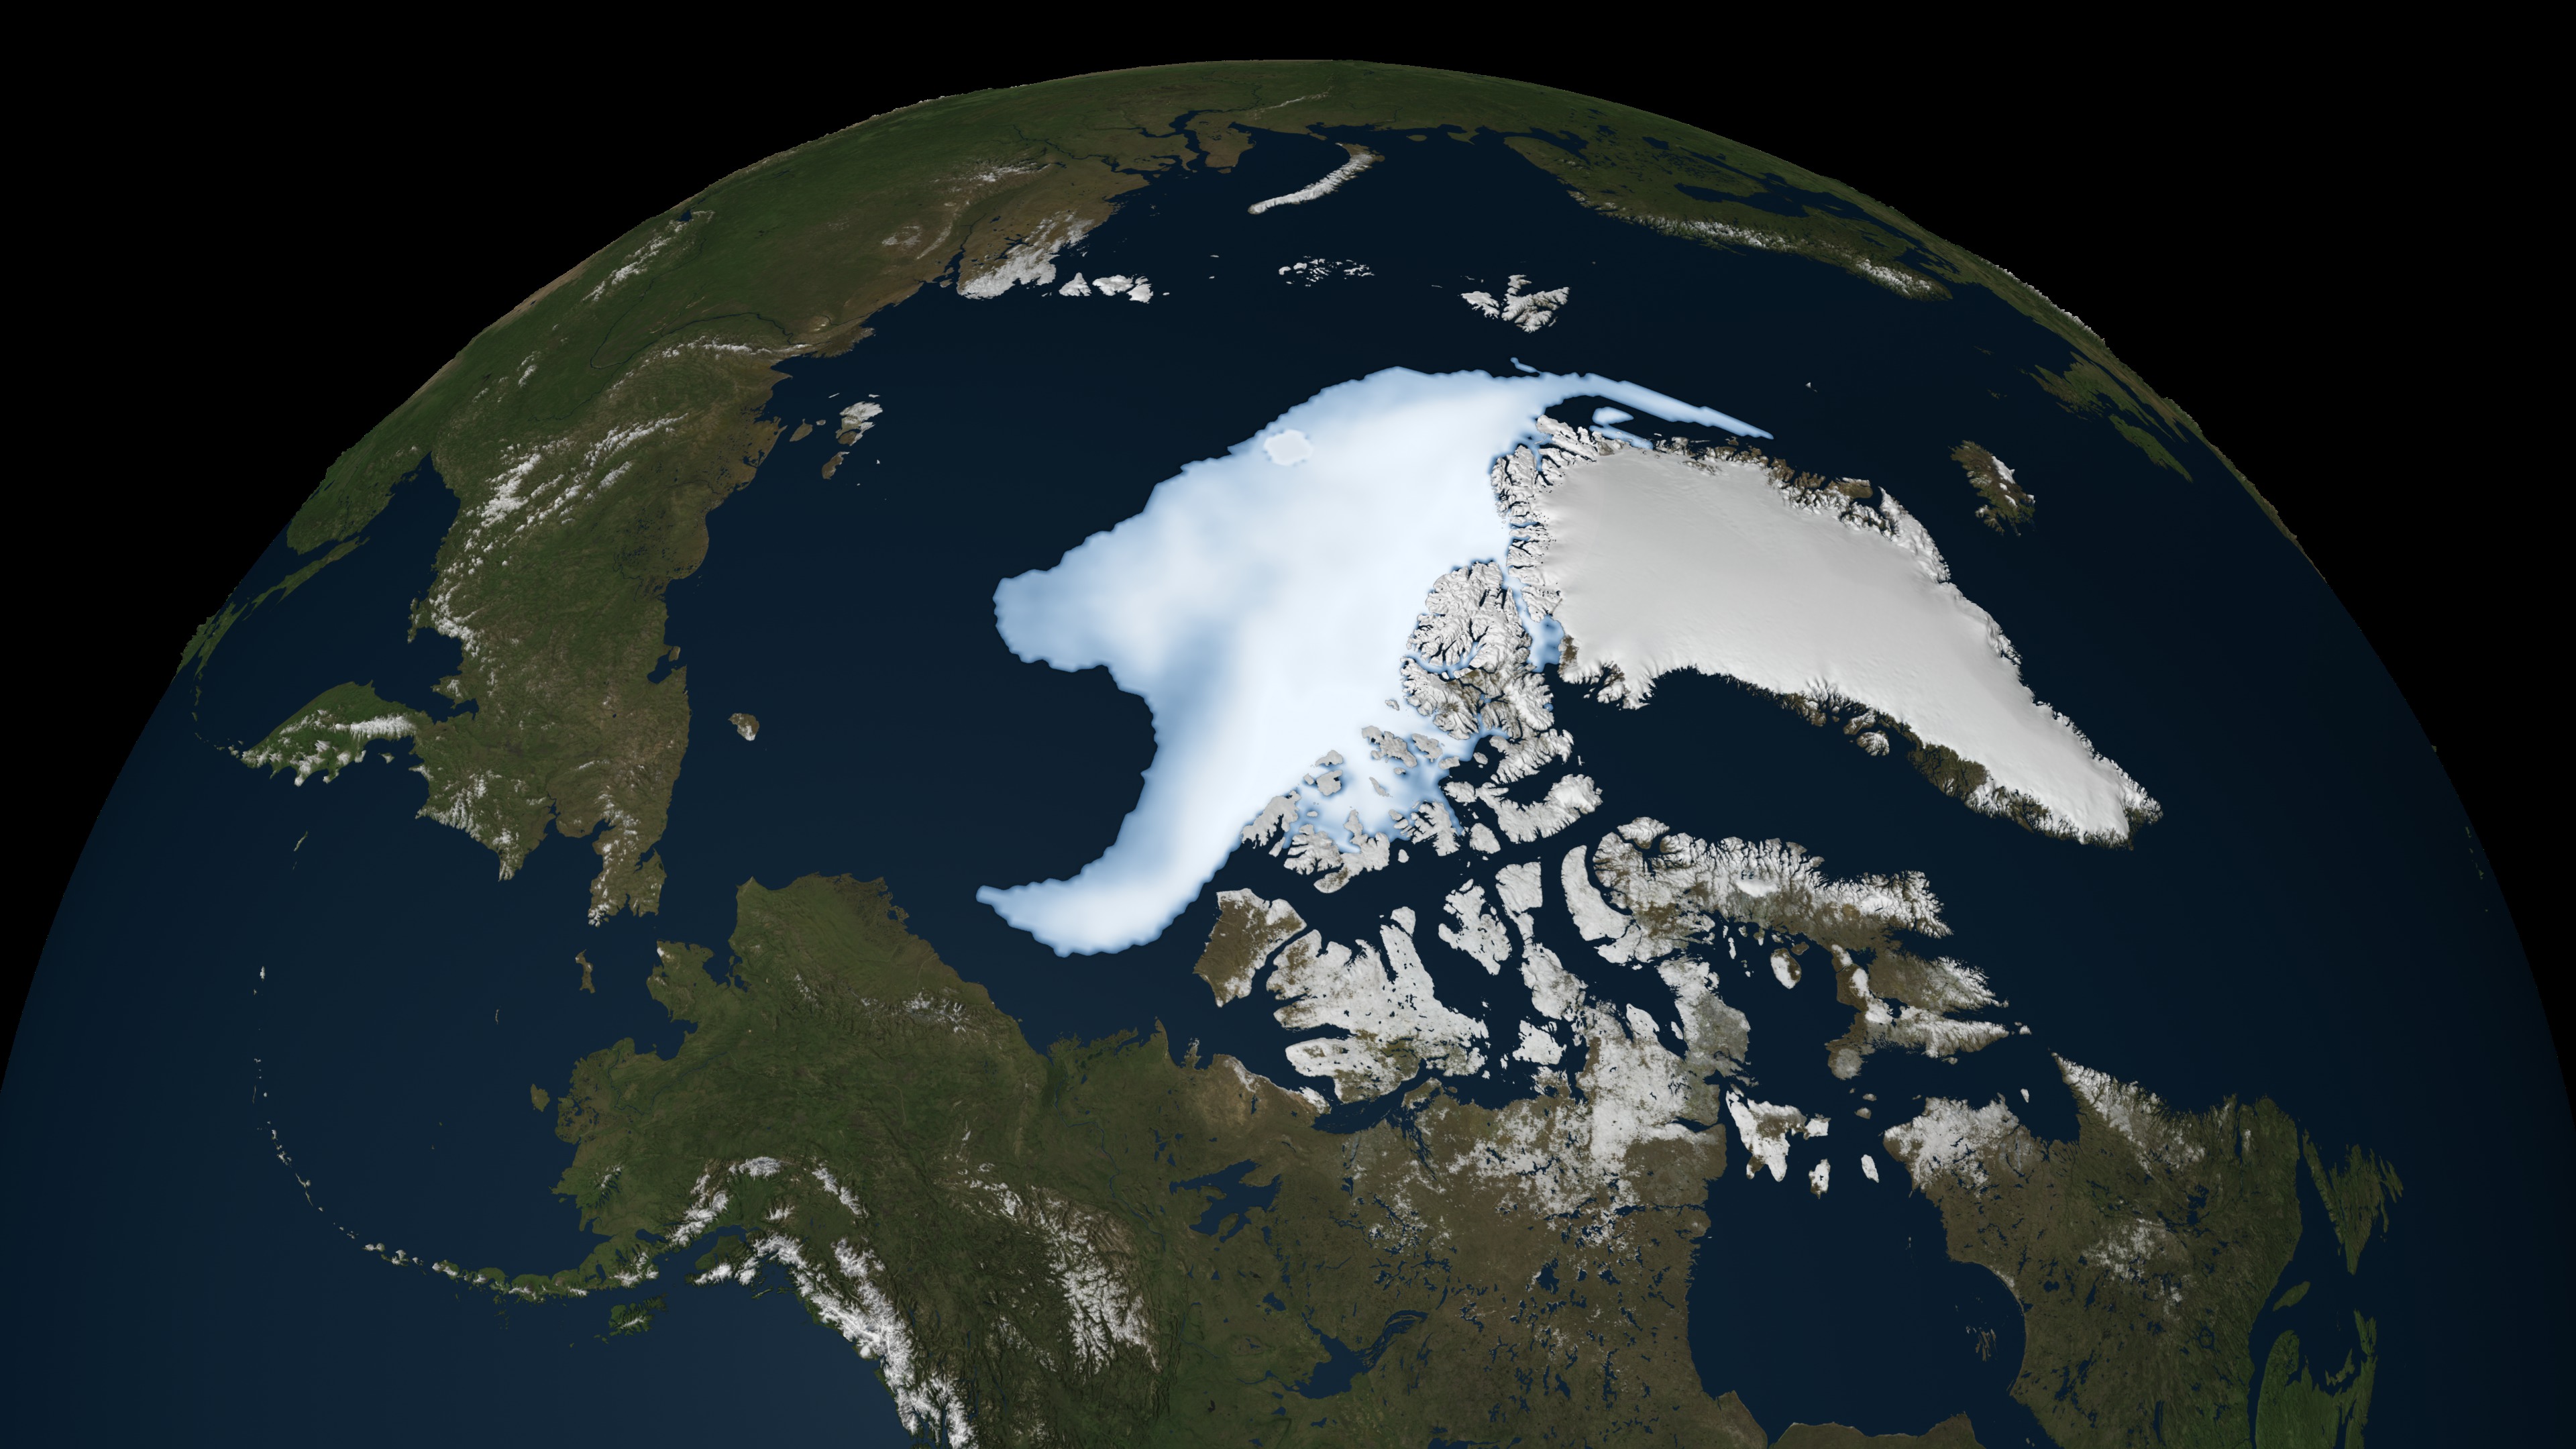
This image shows the multiyear sea ice in 2012.
This image shows the multiyear sea ice in 1980.
This image shows the multiyear sea ice in 2012.
Similar threads
- Replies
- 118
- Views
- 2K
- Replies
- 24
- Views
- 267
- Replies
- 73
- Views
- 2K
- Replies
- 648
- Views
- 7K
Latest Discussions
- Replies
- 119
- Views
- 664
- Replies
- 31
- Views
- 312
Forum List
-
-
-
-
-
Political Satire 8075
-
-
-
-
-
-
-
-
-
-
-
-
-
-
-
-
-
-
-
ObamaCare 781
-
-
-
-
-
-
-
-
-
-
-
Member Usernotes 471
-
-
-
-
-
-
-
-
-
-