Sea Ice : Feature Articles
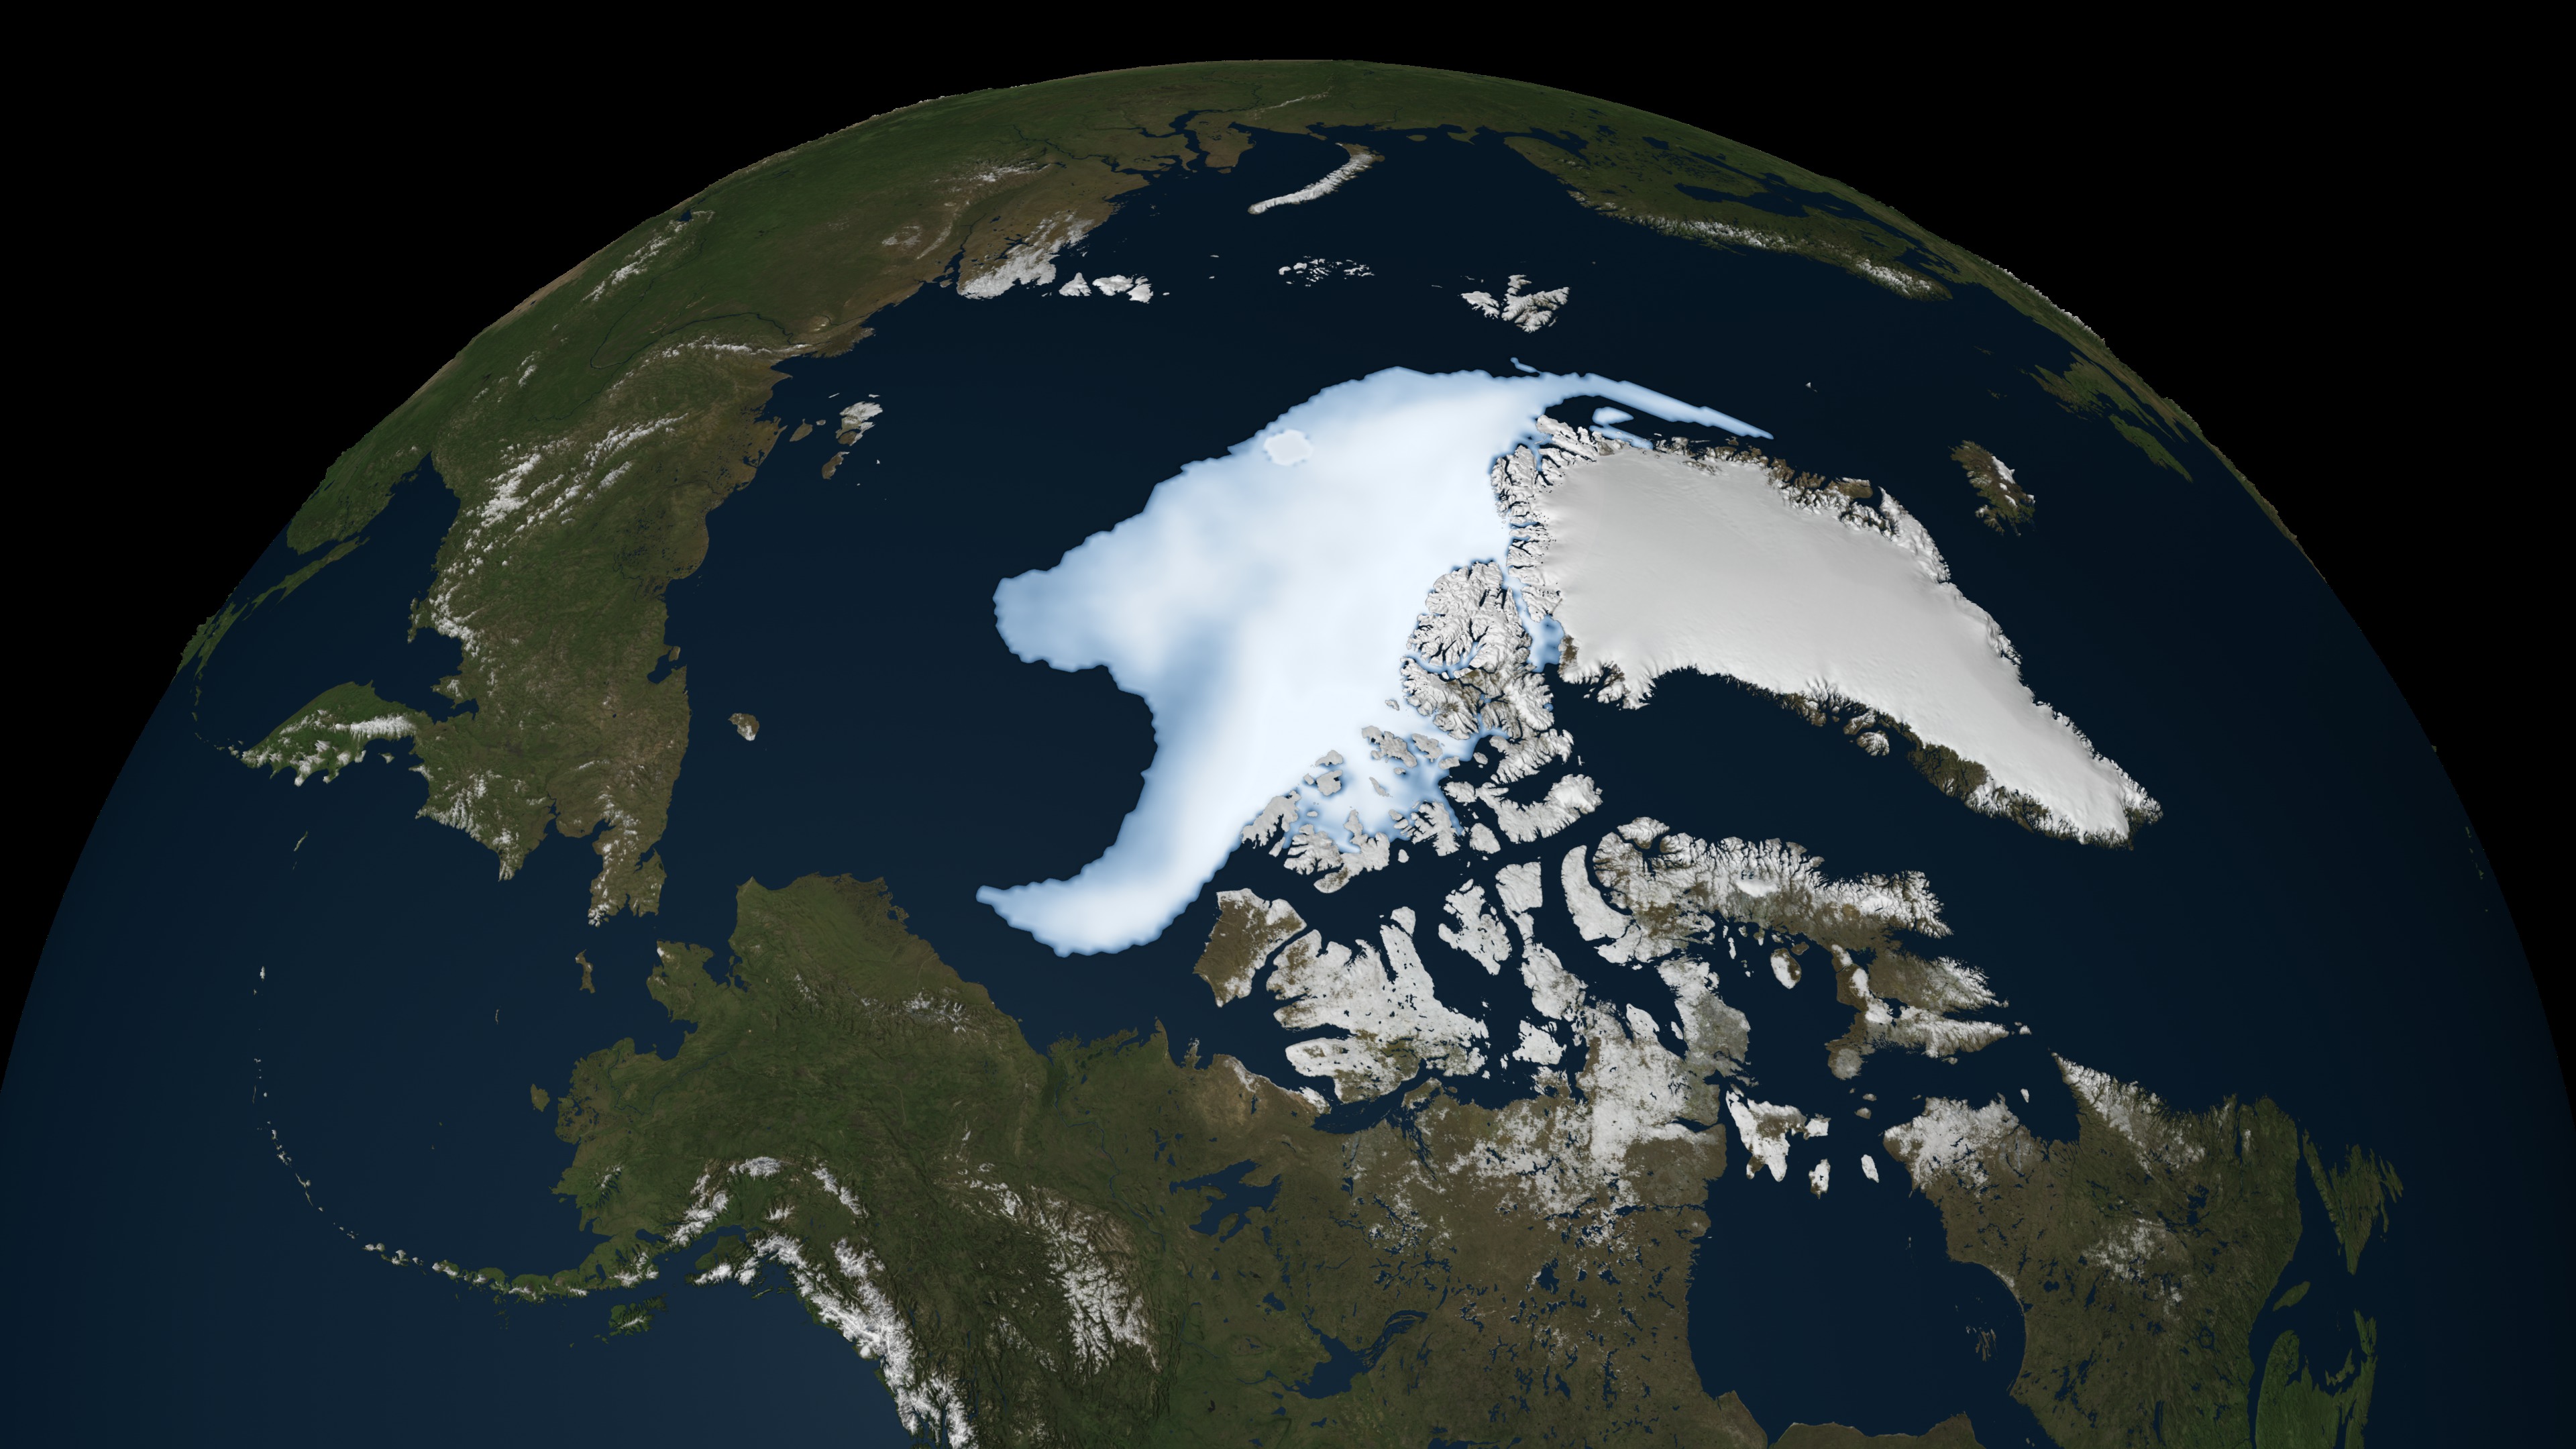
The largest loss of sea ice is north of Siberia and Alaska. The area shown on that map retains a much higher percentage of ice due to ocean currents. You can readily see that on this map from last year.Wow. Would you look at that! There's STILL ice up there. So....when is it going to go away? So far I think there have been 2 or 3 different years that have come and gone where the ice was going to be gone....and still it is there.....laughing at you!
It is only in your fraudulent, deliberately deceptive denier cult mythologies that "there have been 2 or 3 different years that have come and gone where the ice was going to be gone".
In the real world, not too many years ago, the consensus among climate scientists studying the Arctic was that it might take until 2100 for the Arctic to be ice free in the summers.....now, after watching the unexpected speed at which the ice cap is melting, most of these scientists are saying that it will probably be ice free by 2030 or possibly sooner. It has never been the scientific consensus that the north polar ice would all be melted by now.
The world is laughing at you anti-science, reality-challenged denier cult nutjobs.
Show us the science then silly boy. Show us the science. Not computer generated fiction. But real science. Go ahead, I dare you.


 what is real and what isn't? I am beginning to think not.