GuyPinestra
Senior Member
- Jan 29, 2012
- 6,905
- 673
- 48
The problem is SPENDING!
Follow along with the video below to see how to install our site as a web app on your home screen.

Note: This feature currently requires accessing the site using the built-in Safari browser.
The problem is SPENDING!
Oh, the phone program that started under Reagan and continued by Bush, Jr.?Obama is going to tax you all to death, he talks out both sides of his mouth, look on the bottom of you cell phone bill -its you who is paying for all the free phones ,its government induced spread the wealth.Just wait until all the Obamacare horseshit comes on tap-If you make a pay check your screwed..........
View attachment 23072
Are you foolish?
Tax rates are almost as low as they were under Reagan and his "Trickle Down"...which never worked. If the Republican party doesn't go out of their way to reclaim some ordinary voters they are history:

Never worked huh I guess that explains that big economic boom we had in the 80's.
Economic boom? Reagan emptied the state mental hospitals and welfare facilities onto the streets and the homeless reached record numbers. He and GHW Bush quadrupled the national debt and in Jan. 1993 left a higher unemployment number than Jimmy Carter left when he finished. The fact is that Reagan was the first president to cut taxes to record low levels, not cut spending a dime and ruin the labor unions when he fired PATCO.
You want economic boom? One place to look. Bill Clinton raised taxes on the wealthy, generated 22 million new jobs, balanced the annual budget and actually generated $400 billion of surplus. He had straightened out the Reagan/Bush41 mess and had the entire debt on schedule to be paid off by now. Then along came George.
blackhawk sounds TooStupid.
blackhawk sounds TooStupid.
Majority of working class and rich agree: people collecting welfare and public pensions should do our house work or yard work.

Freedom, Marxism? You're fegging brainwashed- let the richest pay a little more like their fair share- they're bloated, the rest are ruined, and you're chumps, PERIOD. LOL
Over the past 60 years the American dream has gradually disappeared. The process was slow, so most people didnt notice. They just worked a few more hours, borrowed a little more and cut back on non-essentials. But looking at the numbers and comparing them over long time periods, it is obvious that things have changed drastically. Here are the details:
1. WORKERS PRODUCE MORE BUT THE GAINS GO TO BUSINESS.
Over the past 63 years worker productivity has grown by 2.0% per year.
But after 1980, workers received a smaller share every year. Labors share of income (1992 = 100%):
1950 = 101%
1960 = 105%
1970 = 105%
1980 = 105% Reagan
1990 = 100%
2000 = 96%
2007 = 92%
A 13% drop since 1980
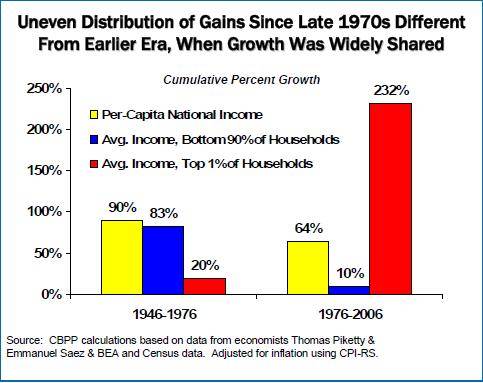
2. THE TOP 10% GET A LARGER SHARE.
Share of National Income going to Top 10%:
1950 = 35%
1960 = 34%
1970 = 34%
1980 = 34% Reagan
1990 = 40%
2000 = 47%
2007 = 50%
An increase of 16% since Reagan.
3. WORKERS COMPENSATED FOR THE LOSS OF INCOME BY SPENDING THEIR SAVINGS.
The savings Rose up to Reagan and fell during and after.
1950 = 6.0%
1960 = 7.0%
1970 = 8.5%
1980 = 10.0% Reagan
1982 = 11.2% Peak
1990 = 7.0%
2000 = 2.0%
2006 = -1.1% (Negative = withdrawing from savings)
A 12.3% drop after Reagan.
4. WORKERS ALSO BORROWED TO MAKE UP FOR THE LOSS.
Household Debt as percentage of GDP:
1965 = 46%
1970 = 45%
1980 = 50% Reagan
1990 = 61%
2000 = 69%
2007 = 95%
A 45% increase after 1980.
5. SO THE GAP BETWEEN THE RICHEST AND THE POOREST HAS GROWN.
Gap Between the Share of Capital Income earned by the top 1%
and the bottom 80%:
1980 = 10%
2003 = 56%
A 5.6 times increase.
6. AND THE AMERICAN DREAM IS GONE.
The Probably of Moving Up from the Bottom 40% to the Top 40%:
1945 = 12%
1958 = 6%
1990 = 3%
2000 = 2%
A 10% Decrease.
Links:
1 = ftp://ftp.bls.gov/pub/special.requests/pf/totalf1.txt
1 = https://www.clevelandfed.org/Research/PolicyDis/No7Nov04.pdf
1 = Clipboard01.jpg (image)
2 Congratulations to Emmanuel Saez | The White House
3 = http://www.demos.org/inequality/images/charts/uspersonalsaving_thumb.gif
3 = http://www.bea.gov/national/nipaweb...able=58&Freq=Qtr&FirstYear=2008&LastYear=2010
4 = PrudentBear
4 = FRB: Z.1 Release--Flow of Funds Accounts of the United States--December 6, 2012
5/6 = Wealth And Inequality In America - Business Insider
Pubcrappe, the problem is the GOP and their dupe/cult. Obama has offered the only actual spending cuts, and anyone with a functioning brain knows the rich need to pay their fair share, MORE than a very reasonable 4%. AND for that matter that O-care will cut spending in a huge way. Pub dupes! The GOP is sociopathic, bought off, and doesn't give a shytte about the country.

So, how much do the 1% and corps ACTUALY pay in all taxes? 17% and 12%, dupes...
Over the past 60 years the American dream has gradually disappeared. The process was slow, so most people didn’t notice. They just worked a few more hours, borrowed a little more and cut back on non-essentials. But looking at the numbers and comparing them over long time periods, it is obvious that things have changed drastically. Here are the details:
1. WORKERS PRODUCE MORE BUT THE GAINS GO TO BUSINESS.
Over the past 63 years worker productivity has grown by 2.0% per year.
But after 1980, workers received a smaller share every year. Labor’s share of income (1992 = 100%):
1950 = 101%
1960 = 105%
1970 = 105%
1980 = 105% – Reagan
1990 = 100%
2000 = 96%
2007 = 92%
A 13% drop since 1980
2. THE TOP 10% GET A LARGER SHARE.
Share of National Income going to Top 10%:
1950 = 35%
1960 = 34%
1970 = 34%
1980 = 34% – Reagan
1990 = 40%
2000 = 47%
2007 = 50%
An increase of 16% since Reagan.
3. WORKERS COMPENSATED FOR THE LOSS OF INCOME BY SPENDING THEIR SAVINGS.
The savings Rose up to Reagan and fell during and after.
1950 = 6.0%
1960 = 7.0%
1970 = 8.5%
1980 = 10.0% – Reagan
1982 = 11.2% – Peak
1990 = 7.0%
2000 = 2.0%
2006 = -1.1% (Negative = withdrawing from savings)
A 12.3% drop after Reagan.
4. WORKERS ALSO BORROWED TO MAKE UP FOR THE LOSS.
Household Debt as percentage of GDP:
1965 = 46%
1970 = 45%
1980 = 50% – Reagan
1990 = 61%
2000 = 69%
2007 = 95%
A 45% increase after 1980.
5. SO THE GAP BETWEEN THE RICHEST AND THE POOREST HAS GROWN.
Gap Between the Share of Capital Income earned by the top 1%
and the bottom 80%:
1980 = 10%
2003 = 56%
A 5.6 times increase.
6. AND THE AMERICAN DREAM IS GONE.
The Probably of Moving Up from the Bottom 40% to the Top 40%:
1945 = 12%
1958 = 6%
1990 = 3%
2000 = 2%
A 10% Decrease.
Links:
1 = ftp://ftp.bls.gov/pub/special.requests/pf/totalf1.txt
1 = https://www.clevelandfed.org/Research/PolicyDis/No7Nov04.pdf
1 = Clipboard01.jpg (image)
2 – Congratulations to Emmanuel Saez | The White House
3 = http://www.demos.org/inequality/images/charts/uspersonalsaving_thumb.gif
3 = http://www.bea.gov/national/nipaweb...able=58&Freq=Qtr&FirstYear=2008&LastYear=2010
4 = PrudentBear
4 = FRB: Z.1 Release--Flow of Funds Accounts of the United States--December 6, 2012
5/6 = Wealth And Inequality In America - Business Insider
Well.....you nailed that:
yawn.
Still pretending that 30 year post WW2 boom wasn't an anomaly, never to be repeated unless the industries of everyone else in the world get bombed out but us?
LOL
Granddaddy's machine tool job - where he slept half of his shift and scolded the new hires for producing too much and making them look bad - is gone forever.
That's a rich man's lie. I was there and saw what happened and you people can either shut up and quit trying to completely destroy every facet of America except your own or next time the ass kicking will be worse...regardless of what Fox News is telecasting from that bubble they live in. Let's see....Dick Morris declared that Romney would win by a landslide and Karl Rove said Romney would get 335 electoral votes. GAWD what wisdom......unmatched in the annals of modern man.
It appears your ability to think critically has been impaired, or you have a genetic deficiency.It appears that the entire response went over your head.Wow. So two different polls, taken at different times, asking different questions, both offer different outcomes/results. Wow, that's just groundbreaking. The arguments will never be the same.
Swing, and a miss.
Not surprising.
Try this. How can anyone say that a poll shows that the American people want more taxes on the rich when they aren't even informed of what the current tax rate is, or that the taxes paid now exceed what the American people deem as 'fair'.
Any clearer for you?
BTW....that was not a miss. Its sailing out of the ball park.
No, it appears you slept through the part in 6th grade math where they told you not to compare apples to oranges.
Let's try and have you be a little less intellectually dishonest, eh Cindy?
Freedom, Marxism? You're fegging brainwashed- let the richest pay a little more like their fair share- they're bloated, the rest are ruined, and you're chumps, PERIOD. LOL
Over the past 60 years the American dream has gradually disappeared. The process was slow, so most people didnt notice. They just worked a few more hours, borrowed a little more and cut back on non-essentials. But looking at the numbers and comparing them over long time periods, it is obvious that things have changed drastically. Here are the details:
1. WORKERS PRODUCE MORE BUT THE GAINS GO TO BUSINESS.
Over the past 63 years worker productivity has grown by 2.0% per year.
But after 1980, workers received a smaller share every year. Labors share of income (1992 = 100%):
1950 = 101%
1960 = 105%
1970 = 105%
1980 = 105% Reagan
1990 = 100%
2000 = 96%
2007 = 92%
A 13% drop since 1980
2. THE TOP 10% GET A LARGER SHARE.
Share of National Income going to Top 10%:
1950 = 35%
1960 = 34%
1970 = 34%
1980 = 34% Reagan
1990 = 40%
2000 = 47%
2007 = 50%
An increase of 16% since Reagan.
3. WORKERS COMPENSATED FOR THE LOSS OF INCOME BY SPENDING THEIR SAVINGS.
The savings Rose up to Reagan and fell during and after.
1950 = 6.0%
1960 = 7.0%
1970 = 8.5%
1980 = 10.0% Reagan
1982 = 11.2% Peak
1990 = 7.0%
2000 = 2.0%
2006 = -1.1% (Negative = withdrawing from savings)
A 12.3% drop after Reagan.
4. WORKERS ALSO BORROWED TO MAKE UP FOR THE LOSS.
Household Debt as percentage of GDP:
1965 = 46%
1970 = 45%
1980 = 50% Reagan
1990 = 61%
2000 = 69%
2007 = 95%
A 45% increase after 1980.
5. SO THE GAP BETWEEN THE RICHEST AND THE POOREST HAS GROWN.
Gap Between the Share of Capital Income earned by the top 1%
and the bottom 80%:
1980 = 10%
2003 = 56%
A 5.6 times increase.
6. AND THE AMERICAN DREAM IS GONE.
The Probably of Moving Up from the Bottom 40% to the Top 40%:
1945 = 12%
1958 = 6%
1990 = 3%
2000 = 2%
A 10% Decrease.
Links:
1 = ftp://ftp.bls.gov/pub/special.requests/pf/totalf1.txt
1 = https://www.clevelandfed.org/Research/PolicyDis/No7Nov04.pdf
1 = Clipboard01.jpg (image)
2 Congratulations to Emmanuel Saez | The White House
3 = http://www.demos.org/inequality/images/charts/uspersonalsaving_thumb.gif
3 = http://www.bea.gov/national/nipaweb...able=58&Freq=Qtr&FirstYear=2008&LastYear=2010
4 = PrudentBear
4 = FRB: Z.1 Release--Flow of Funds Accounts of the United States--December 6, 2012
5/6 = Wealth And Inequality In America - Business Insider
So you want to control outcome, by not controlling freedom?? With that tripe, you cannot tell anyone you are for freedom.... You don't want to control YOUR freedoms. You have no concern whether you control the freedom of others
You just don't get that if you want more you are the one responsible for getting it... you don't get to use government to get it for you[/QUOTE]
You must mean that ONLY the ultra wealthy get to use the government to get it for you.
Like ruining banks and brokergages and getting the guvmint to bail your ass out. While you keep getting your millions of dollars as bonus and salary.
Or using your ultra wealth to influence the tax writing committee so that you get favorable tax treatment for your ultra wealth.
Or using your wealth to get government no bid contracts. So you can overcharge and make more millions.
Yes sir I can see what you mean. Don't let the government make or keep you rich. Why that would be un American. LMAO.
blackhawk sounds TooStupid.
Typical response of those who can dispute facts and truth insult and demean when you can't debate.
blackhawk sounds TooStupid.
Doesn't sound like a very Christ-like response. If he said something wrong, wouldn't it be better to correct him in a kind and loving way?
I know, easier said then done.
