Stephanie
Diamond Member
- Jul 11, 2004
- 70,230
- 10,864
- 2,040
If 65% wanted to enslave the remaining 35% would that make it alright?
Would you go along with it?
they would if that's what their Dear Leader wanted..
such sheep
Follow along with the video below to see how to install our site as a web app on your home screen.
Note: This feature may not be available in some browsers.
If 65% wanted to enslave the remaining 35% would that make it alright?
Would you go along with it?
It appears that the entire response went over your head.
Wow. So two different polls, taken at different times, asking different questions, both offer different outcomes/results. Wow, that's just groundbreaking. The arguments will never be the same.
Swing, and a miss.
Not surprising.
Try this. How can anyone say that a poll shows that the American people want more taxes on the rich when they aren't even informed of what the current tax rate is, or that the taxes paid now exceed what the American people deem as 'fair'.
Any clearer for you?
BTW....that was not a miss. Its sailing out of the ball park.
The richest 1% have tripled their wealth under voodoo, gotten 93% of the growth the last 4 years, whike the nonrich and the country are slowly ruined.
The dupes are totally brainwashed on here. A 4% rise, and they're talking communism. Ignorant idiocy...
I don't favor it but go ahead and do it. Watch the rich do as Google CEO and big support of obama send millions offshore or pay dividends for 2013 in 2012 to avoid paying higher taxes.
It appears that the entire response went over your head.
Wow. So two different polls, taken at different times, asking different questions, both offer different outcomes/results. Wow, that's just groundbreaking. The arguments will never be the same.
Swing, and a miss.
Not surprising.
Try this. How can anyone say that a poll shows that the American people want more taxes on the rich when they aren't even informed of what the current tax rate is, or that the taxes paid now exceed what the American people deem as 'fair'.
Any clearer for you?
BTW....that was not a miss. Its sailing out of the ball park.
It appears that the entire response went over your head.Wow. So two different polls, taken at different times, asking different questions, both offer different outcomes/results. Wow, that's just groundbreaking. The arguments will never be the same.
Swing, and a miss.
Not surprising.
Try this. How can anyone say that a poll shows that the American people want more taxes on the rich when they aren't even informed of what the current tax rate is, or that the taxes paid now exceed what the American people deem as 'fair'.
Any clearer for you?
BTW....that was not a miss. Its sailing out of the ball park.
The majority will always support taxing someone else. Whats the old saying the party that takes from Peter to give to Paul will always have the support of Paul?

It appears that the entire response went over your head.
Not surprising.
Try this. How can anyone say that a poll shows that the American people want more taxes on the rich when they aren't even informed of what the current tax rate is, or that the taxes paid now exceed what the American people deem as 'fair'.
Any clearer for you?
BTW....that was not a miss. Its sailing out of the ball park.
The majority will always support taxing someone else. Whats the old saying the party that takes from Peter to give to Paul will always have the support of Paul?
Are you foolish?
Tax rates are almost as low as they were under Reagan and his "Trickle Down"...which never worked. If the Republican party doesn't go out of their way to reclaim some ordinary voters they are history:
Never worked huh I guess that explains that big economic boom we had in the 80's.
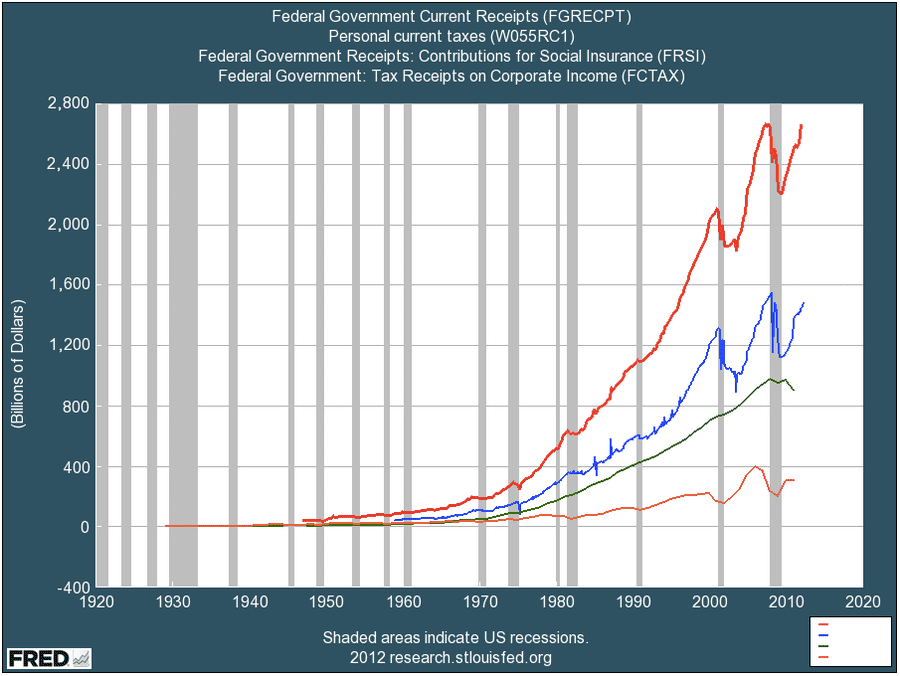
So, how much do the 1% and corps ACTUALY pay in all taxes? 17% and 12%, dupes...
Over the past 60 years the American dream has gradually disappeared. The process was slow, so most people didnt notice. They just worked a few more hours, borrowed a little more and cut back on non-essentials. But looking at the numbers and comparing them over long time periods, it is obvious that things have changed drastically. Here are the details:
1. WORKERS PRODUCE MORE BUT THE GAINS GO TO BUSINESS.
Over the past 63 years worker productivity has grown by 2.0% per year.
But after 1980, workers received a smaller share every year. Labors share of income (1992 = 100%):
1950 = 101%
1960 = 105%
1970 = 105%
1980 = 105% Reagan
1990 = 100%
2000 = 96%
2007 = 92%
A 13% drop since 1980
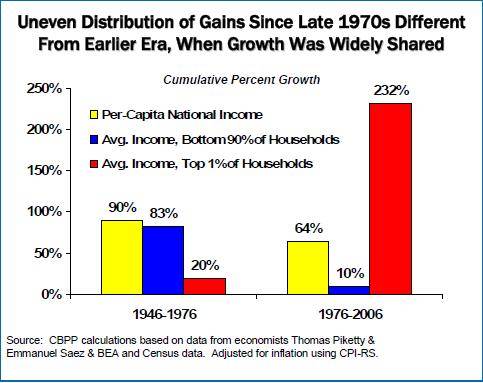
2. THE TOP 10% GET A LARGER SHARE.
Share of National Income going to Top 10%:
1950 = 35%
1960 = 34%
1970 = 34%
1980 = 34% Reagan
1990 = 40%
2000 = 47%
2007 = 50%
An increase of 16% since Reagan.
3. WORKERS COMPENSATED FOR THE LOSS OF INCOME BY SPENDING THEIR SAVINGS.
The savings Rose up to Reagan and fell during and after.
1950 = 6.0%
1960 = 7.0%
1970 = 8.5%
1980 = 10.0% Reagan
1982 = 11.2% Peak
1990 = 7.0%
2000 = 2.0%
2006 = -1.1% (Negative = withdrawing from savings)
A 12.3% drop after Reagan.
4. WORKERS ALSO BORROWED TO MAKE UP FOR THE LOSS.
Household Debt as percentage of GDP:
1965 = 46%
1970 = 45%
1980 = 50% Reagan
1990 = 61%
2000 = 69%
2007 = 95%
A 45% increase after 1980.
5. SO THE GAP BETWEEN THE RICHEST AND THE POOREST HAS GROWN.
Gap Between the Share of Capital Income earned by the top 1%
and the bottom 80%:
1980 = 10%
2003 = 56%
A 5.6 times increase.
6. AND THE AMERICAN DREAM IS GONE.
The Probably of Moving Up from the Bottom 40% to the Top 40%:
1945 = 12%
1958 = 6%
1990 = 3%
2000 = 2%
A 10% Decrease.
Links:
1 = ftp://ftp.bls.gov/pub/special.requests/pf/totalf1.txt
1 = https://www.clevelandfed.org/Research/PolicyDis/No7Nov04.pdf
1 = Clipboard01.jpg (image)
2 Congratulations to Emmanuel Saez | The White House
3 = http://www.demos.org/inequality/images/charts/uspersonalsaving_thumb.gif
3 = http://www.bea.gov/national/nipaweb...able=58&Freq=Qtr&FirstYear=2008&LastYear=2010
4 = PrudentBear
4 = FRB: Z.1 Release--Flow of Funds Accounts of the United States--December 6, 2012
5/6 = Wealth And Inequality In America - Business Insider
So, how much do the 1% and corps ACTUALY pay in all taxes? 17% and 12%, dupes...
Over the past 60 years the American dream has gradually disappeared. The process was slow, so most people didnt notice. They just worked a few more hours, borrowed a little more and cut back on non-essentials. But looking at the numbers and comparing them over long time periods, it is obvious that things have changed drastically. Here are the details:
1. WORKERS PRODUCE MORE BUT THE GAINS GO TO BUSINESS.
Over the past 63 years worker productivity has grown by 2.0% per year.
But after 1980, workers received a smaller share every year. Labors share of income (1992 = 100%):
1950 = 101%
1960 = 105%
1970 = 105%
1980 = 105% Reagan
1990 = 100%
2000 = 96%
2007 = 92%
A 13% drop since 1980
2. THE TOP 10% GET A LARGER SHARE.
Share of National Income going to Top 10%:
1950 = 35%
1960 = 34%
1970 = 34%
1980 = 34% Reagan
1990 = 40%
2000 = 47%
2007 = 50%
An increase of 16% since Reagan.
3. WORKERS COMPENSATED FOR THE LOSS OF INCOME BY SPENDING THEIR SAVINGS.
The savings Rose up to Reagan and fell during and after.
1950 = 6.0%
1960 = 7.0%
1970 = 8.5%
1980 = 10.0% Reagan
1982 = 11.2% Peak
1990 = 7.0%
2000 = 2.0%
2006 = -1.1% (Negative = withdrawing from savings)
A 12.3% drop after Reagan.
4. WORKERS ALSO BORROWED TO MAKE UP FOR THE LOSS.
Household Debt as percentage of GDP:
1965 = 46%
1970 = 45%
1980 = 50% Reagan
1990 = 61%
2000 = 69%
2007 = 95%
A 45% increase after 1980.
5. SO THE GAP BETWEEN THE RICHEST AND THE POOREST HAS GROWN.
Gap Between the Share of Capital Income earned by the top 1%
and the bottom 80%:
1980 = 10%
2003 = 56%
A 5.6 times increase.
6. AND THE AMERICAN DREAM IS GONE.
The Probably of Moving Up from the Bottom 40% to the Top 40%:
1945 = 12%
1958 = 6%
1990 = 3%
2000 = 2%
A 10% Decrease.
Links:
1 = ftp://ftp.bls.gov/pub/special.requests/pf/totalf1.txt
1 = https://www.clevelandfed.org/Research/PolicyDis/No7Nov04.pdf
1 = Clipboard01.jpg (image)
2 Congratulations to Emmanuel Saez | The White House
3 = http://www.demos.org/inequality/images/charts/uspersonalsaving_thumb.gif
3 = http://www.bea.gov/national/nipaweb...able=58&Freq=Qtr&FirstYear=2008&LastYear=2010
4 = PrudentBear
4 = FRB: Z.1 Release--Flow of Funds Accounts of the United States--December 6, 2012
5/6 = Wealth And Inequality In America - Business Insider
Well.....you nailed that:
Freedom, Marxism? You're fegging brainwashed- let the richest pay a little more like their fair share- they're bloated, the rest are ruined, and you're chumps, PERIOD. LOL
Over the past 60 years the American dream has gradually disappeared. The process was slow, so most people didnt notice. They just worked a few more hours, borrowed a little more and cut back on non-essentials. But looking at the numbers and comparing them over long time periods, it is obvious that things have changed drastically. Here are the details:
1. WORKERS PRODUCE MORE BUT THE GAINS GO TO BUSINESS.
Over the past 63 years worker productivity has grown by 2.0% per year.
But after 1980, workers received a smaller share every year. Labors share of income (1992 = 100%):
1950 = 101%
1960 = 105%
1970 = 105%
1980 = 105% Reagan
1990 = 100%
2000 = 96%
2007 = 92%
A 13% drop since 1980
2. THE TOP 10% GET A LARGER SHARE.
Share of National Income going to Top 10%:
1950 = 35%
1960 = 34%
1970 = 34%
1980 = 34% Reagan
1990 = 40%
2000 = 47%
2007 = 50%
An increase of 16% since Reagan.
3. WORKERS COMPENSATED FOR THE LOSS OF INCOME BY SPENDING THEIR SAVINGS.
The savings Rose up to Reagan and fell during and after.
1950 = 6.0%
1960 = 7.0%
1970 = 8.5%
1980 = 10.0% Reagan
1982 = 11.2% Peak
1990 = 7.0%
2000 = 2.0%
2006 = -1.1% (Negative = withdrawing from savings)
A 12.3% drop after Reagan.
4. WORKERS ALSO BORROWED TO MAKE UP FOR THE LOSS.
Household Debt as percentage of GDP:
1965 = 46%
1970 = 45%
1980 = 50% Reagan
1990 = 61%
2000 = 69%
2007 = 95%
A 45% increase after 1980.
5. SO THE GAP BETWEEN THE RICHEST AND THE POOREST HAS GROWN.
Gap Between the Share of Capital Income earned by the top 1%
and the bottom 80%:
1980 = 10%
2003 = 56%
A 5.6 times increase.
6. AND THE AMERICAN DREAM IS GONE.
The Probably of Moving Up from the Bottom 40% to the Top 40%:
1945 = 12%
1958 = 6%
1990 = 3%
2000 = 2%
A 10% Decrease.
Links:
1 = ftp://ftp.bls.gov/pub/special.requests/pf/totalf1.txt
1 = https://www.clevelandfed.org/Research/PolicyDis/No7Nov04.pdf
1 = Clipboard01.jpg (image)
2 Congratulations to Emmanuel Saez | The White House
3 = http://www.demos.org/inequality/images/charts/uspersonalsaving_thumb.gif
3 = http://www.bea.gov/national/nipaweb...able=58&Freq=Qtr&FirstYear=2008&LastYear=2010
4 = PrudentBear
4 = FRB: Z.1 Release--Flow of Funds Accounts of the United States--December 6, 2012
5/6 = Wealth And Inequality In America - Business Insider
It appears that the entire response went over your head.
Not surprising.
Try this. How can anyone say that a poll shows that the American people want more taxes on the rich when they aren't even informed of what the current tax rate is, or that the taxes paid now exceed what the American people deem as 'fair'.
Any clearer for you?
BTW....that was not a miss. Its sailing out of the ball park.
The majority will always support taxing someone else. Whats the old saying the party that takes from Peter to give to Paul will always have the support of Paul?
Are you foolish?
Tax rates are almost as low as they were under Reagan and his "Trickle Down"...which never worked. If the Republican party doesn't go out of their way to reclaim some ordinary voters they are history: