2011 global temperature thread

Nore on james hansen...

The nation's most prominent publicly funded climatologist is officially angry about this, blaming democracy and citing the Chinese government as the "best hope" to save the world from global warming. He also wants an economic boycott of the U.S. sufficient to bend us to China's will.
Nice to see public sector employyes supporting THIS nation. The friggin' idiot is an ideologue with an agenda and nothing more.

MICHAELS: China-style dictatorship of climatologists - Washington Times
 
Climate Prediction Center Weekly Update at 1/18/11

More cooler the Nino 3.4 area than two weeks ago,meaning that La Nina is here to stay thru the Spring months and maybe thru the Summer as CFS model shows.

Three Weeks Ago Update

Niño 4= -1.3ºC
Niño= 3.4 -1.5ºC
Niño 3= -1.7ºC
Niño1+2= -1.7ºC


This Week Update

Niño 4= -1.6ºC
Niño 3.4= -1.8ºC
Niño 3= -1.5ºC
Niño1+2= -0.7ºC

http://www.cpc.ncep.noaa.gov/products/a ... ts-web.pdf

Back up to -1.8c within 3.4...Impressive.


This event goes to 150 east with -2c waters at 160-180 west. 2008 does not come close to this. But it does seem to be focusing more westward as area 1+2 off south America and area 3 have warmed and area 3.4 and 4 have went down.

With this information in mind---This year may not be within the top 10. 2008 went to moderate by the summer time. I think we if this does go the way it may then we might be tied with 1999-2000, 1996 maybe a possibility.
 
ssttable.gif

http://iri.columbia.edu/climate/ENSO/cu ... table.html

Quote:
Current Conditions
As of mid-January 2011, SSTs continue to indicate moderate to strong La Niña conditions in the central and eastern equatorial Pacific. For December the SST anomaly in the NINO3.4 region was -1.53 C, indicative of moderate to strong La Niña conditions, and for the October-December season the anomaly was -1.52 C. Currently the IRI's definition of El Niño conditions rests on an index of SST anomalies, averaged over the NINO3.4 region (5S-5N; 170W-120W), exceeding the warmest 25%-ile of the historical distribution, and similarly for La Niña relative to the 25%-ile coldest conditions in the historical distribution. The NINO3.4 anomaly necessary to qualify as La Niña or El Niño conditions for the Jan-Feb-Mar and the Feb-Mar-Apr seasons are approximately (-0.55C, 0.50) and (-0.45, 0.40), respectively.


Expected Conditions
The most recent weekly SST anomaly in the NINO3.4 region is -1.7 C, indicating moderate to strong La Niña conditions in the tropical Pacific; this is just slightly cooler than the -1.53 C level observed in December. What is the outlook for the ENSO status going forward? January is a time of the year during which the observed ENSO state is often beginning to move toward weaker anomaly values, particularly if an ENSO episode has been occurring. One might ask whether the current La Niña condition should therefore be expected to weaken, and if so, at what rate. In the current case, negative subsurface sea temperature anomalies have continued to occupy the central and eastern equatorial Pacific, and have shown little tendency to weaken even in the last one to two months as the event has been in the process of discharging at the surface. Sea temperature anomalies below the surface often portend SST anomalies to be expected in the following few months, as they are subject to the climatological upwelling in the eastern part of the basin. Current low-level wind anomalies indicate much enhanced trades, especially in the western and west-central portion of the tropical Pacific, and very strongly positive traditional and equatorial SOI indices. These atmospheric features imply above-average upwelling activity in the eastern tropical Pacific, at least for the near term, and suggest that the negative subsurface sea temperature anomalies will likely continue to find their way to the surface during the coming two or more months. The continued surfacing of below-average subsurface waters implies a likelihood for short-term (at least one month) continuation of the strength of the currently moderate to strong La Niña conditions, despite that the seasonal cycle of ENSO suggests a typical decline in strength at this time of year. Above-average subsurface waters exist in the western tropical Pacific, and although they have been edging eastward during the last few months they do not appear poised to displace the large volume of below-average water to their east for at least two or more months, and possibly longer.

Presently, the models and observations taken together indicate probabilities of approximately 98% for maintaining La Niña conditions, near 2% for returning to ENSO-neutral conditions, and nearly 0% for developing El Niño conditions during the Jan-Mar 2011 season in progress. Probabilities for La Niña decrease slightly to 88% for Feb-Apr, and to 67% for Mar-May. In late northern spring the probabilities for La Niña weaken at a faster rate, declining to 46% for Apr-Jun and to 27% for Jun-Aug and for the following several seasons.


The above assessment was made in part on the basis of an examination of the current predictions of ENSO prediction models as well as the observed conditions. For purposes of this discussion, El Niño SST conditions are defined as SSTs in the NINO3.4 region being in the warmest 25% of their climatological distribution for the 3-month period in question over the 1950-present timeframe. The corresponding cutoff in terms of degrees C of SST anomaly varies seasonally, being close to 0.40 degrees C in boreal late-spring to early-summer season and as high as 0.75 degrees C in late boreal autumn. La Niña conditions are defined as NINO3.4 region SSTs being in the coolest 25% of the climatological distribution. Neutral conditions occupy the remaining 50% of the distribution. These definitions were developed such that the most commonly accepted El Niño and La Niña episodes are reproduced.

The models show unanimous agreement regarding the continuation of La Niña conditions into part of the second quarter of 2011, but vary somewhat in their predictions of the rate of decreasing strength starting from the Jan-Mar season. Most statistical and dynamical models call for at least moderate La Niña strength (stronger than -1C) through the Feb-Apr season. For the Jan-Mar, Feb-Apr and Mar-May seasons, 100% of the models are predicting La Niña conditions, while none predicts ENSO-neutral conditions. Following Mar-May, some models begin indicating a return to neutral ENSO conditions, but not to the point of being a majority until the May-Jul season. By Jul-Sep, two of the 23 models call for weak El Niño conditions. At lead times of 4 or more months into the future, statistical and dynamical models that incorporate information about the ocean's observed subsurface thermal structure generally exhibit higher predictive skill than those that do not. Among models that do use subsurface temperature information, 6 of 13 (46%) predict ENSO-neutral SSTs for the Jun-Aug seasons, 6 of 13 (46%) predict La Niña conditions, and 1 of 13 (8%) predict El Niño conditions. (Note 1). (Note that La Niña conditions for Jun-Aug require a NINO3.4 SST anomaly of -0.50 or stronger, and El Niño conditions require 0.45 or stronger.) Caution is advised in interpreting the distribution of model predictions as the actual probabilities. At longer leads, the skill of the models degrades, and skill uncertainty must be convolved with the uncertainties from initial conditions and differing model physics, leading to more climatological probabilities in the long-lead ENSO Outlook than might be suggested by the suite of models. Furthermore, the expected skill of one model versus another has not been established using uniform validation procedures, which may cause a difference in the true probability distribution from that taken verbatim from the raw model predictions.


An alternative way to assess the probabilities of the three possible ENSO conditions is to use the mean of the predictions of all models, and to construct a standard error function centered on that mean. The standard error would be Gaussian in shape, and would have its width determined by an estimate of overall expected model skill for the season of the year and the lead time. Higher skill would result in a relatively narrower error distribution, while low skill would result in an error distribution with width approaching that of the historical observed distribution. This method shows probabilities for La Niña at near 100% for Jan-Mar and Feb-Apr, declining to 95% for Mar-May and 69% for Apr-Jun. (Note that the threshold for La Niña weakens from approximately -0.55C to -0.45C between Jan-Mar and Apr-Jun, due to the seasonality of the interannual variance). The forecasters believe, however, that the northern spring model-based probabilities for La Niña may be higher than it should be, due to a common model bias of persisting ENSO episodes for too long a duration at the end of their typical seasonal cycle. Model probabilities for La Niña are 46% for May-Jul, and decrease to less than 40% for Jul-Sep and beyond. The same cautions mentioned above for the distribution of model predictions apply to this alternative method of inferring probabilities, due to differing model biases and skills. In particular, this approach considers only the mean of the predictions, and not the range across the models, nor the ensemble range within individual models.
 
2001 95.6 80.6 113.5 107.7 96.6 134.0 81.8 106.4 150.7 125.5 106.5 132.2
2002 114.1 107.4 98.4 120.7 120.8 88.3 99.6 116.4 109.6 97.5 95.5 80.8
2003 79.7 46.0 61.1 60.0 54.6 77.4 83.3 72.7 48.7 65.5 67.3 46.5
2004 37.3 45.8 49.1 39.3 41.5 43.2 51.1 40.9 27.7 48.0 43.5 17.9
2005 31.3 29.2 24.5 24.2 42.7 39.3 40.1 36.4 21.9 8.7 18.0 41.1

2006 15.3 4.9 10.6 30.2 22.3 13.9 12.2 12.9 14.4 10.5 21.4 13.6
2007 16.8 10.7 4.5 3.4 11.7 12.1 9.7 6.0 2.4 0.9 1.7 10.1
2008 3.3 2.1 9.3 2.9 3.2 3.4 0.8 0.5 1.1 2.9 4.1 0.8
2009 1.3 1.4 0.7 0.8 2.9 2.9 3.2 0.0 4.3 4.8 4.1 10.8
2010 13.2 18.8 15.4 8.0 8.7 13.6 16.1 19.6 25.2 23.5 21.6 14.5


The shaded area is the grand minimum...

Sun spot number per month. ftp://ftp.ngdc.noaa.gov/STP/SOLAR_DATA/SUNSPOT_NUMBERS/INTERNATIONAL/monthly/MONTHLY
 
Just to correct a mistaken claim from earlier in the thread about CRU and UAH being in agreement with Hansen and his GIGO temperature reconstructions.

Apparently even these AGW activist agencies make NO such claim as 1998 is still the warmest year in the instumental period

View attachment 12701

data sets here

http://vortex.nsstc.uah.edu/public/msu/t2lt/uahncdc.lt

http://www.cru.uea.ac.uk/cru/data/temperature/hadcrut3vgl.txt

Hansen... lying again

1# CRU dont include 75% of the arctic that is warming at 3 times as fast the rest of the Planet...Most of Africa, Antarctica. Ecwmf did a study on it and found that if this data was included they would be very close to giss.

2# Uah factors in the enso nearly twice as much as surface stations because the troposphere is more effected by it then the surface.

But most importantly 1998 was a super nino that never went nina until Nov of 1998 and was tiny compared to the one that started in May this year. I doubt any effects of it occurred before Feb, March 1999. You have to use the same standards for 1998 as you use in 2010 and the nino was twice as strong in 1998 with a tinie nina comparably to this years.
 
Last edited:
Just to correct a mistaken claim from earlier in the thread about CRU and UAH being in agreement with Hansen and his GIGO temperature reconstructions.

Apparently even these AGW activist agencies make NO such claim as 1998 is still the warmest year in the instumental period

View attachment 12701

data sets here

http://vortex.nsstc.uah.edu/public/msu/t2lt/uahncdc.lt

http://www.cru.uea.ac.uk/cru/data/temperature/hadcrut3vgl.txt

Hansen... lying again

1# CRU dont include 75% of the arctic that is warming at 3 times as fast the rest of the Planet...Most of Africa, Antarctica. Ecwmf did a study on it and found that if this data was included they would be very close to giss.
If you choose to believe hansen and his ignoring in situ SST data in favor of gridding of land surface temperatures over water... yeah, that could be waht the data says.

2# Uah factors in the enso nearly twice as much as surface stations because the troposphere is more effected by it then the surface.
lower trop. Uah measures lower trop

But most importantly 1998 was a super nino that never went nina until Nov of 1998 and was tiny compared to the one that started in May this year. I doubt any effects of it occurred before Feb, March 1999. You have to use the same standards for 1998 as you use in 2010 and the nino was twice as strong in 1998 with a tinie nina comparably to this years.
niether of which change the actual tempertures recorded. There are a lot of reasons for climate fluctuations and 99% of them are natural. ENSO, PDO, AO, DWOC, (GCR's, SCR's, and SO2's role in cloud formation), clouds, solar variables (other than irradiation), galactic clouds, magnetic fluctuations and storms, Albedo, black carbon, vulcanism, particulate matter, Ozone. Lots and lots of things.
 
Personally I think all the temperature monitors are suspect. GISS is a joke. NOAA is not much better, UAH at least makes an attempt but Spencer admitted that the satellite data is suspect.

In the end though it honestly doesn't matter. We are seeing the second year in a row where the winter temps have been far colder than was predicted by the best "consensus scientists on the planet" so their opinions rally don't hold much water anymore.

Piers Corbyn and others like him accurately predicted last winters record cold and they predicted this years. More troubling is Corbyn has predicted that this could go on for the next 20 years or even a little longer. So I'm going to follow Corbyns lead and say the temps are going to continue cold for the next 20 years or so.

And it is all natural.

Westwall, It's hard to believe that a lie of this scale could be happening if it was occurring. If global warming is proven to be a fraud then all our temperature data has been screwed with to the point that we may never have had a record that is trustworthy and would need to start over again. A trillion dollar scam....The skeptics argue a case of fraud and it is all a lie, but can they prove that the arctic has not warmed and that the theory that this air could be caused by a shift within the weather pattern as the pro global warmers say? And since the pro global warmers have nearly total control over all temperature data then how would we know one way or the other?

No data shows a cooling trend and being such it is controled by the scienctist that are pro global warming then we wouldn't know if a full fledged ice age was coming either way.

It is hard for me to wrap my head around such treason and fraud if that was the case. Most of science would be damaged for a long time..

Science will not be damaged, because the people who commit this fraud are not scientists.
The only science involved here is political science and it`s quite easy to show this.

I don`t want to repeat what I posted concerning the science of how much infrared CO2 can absorb, or what really melts the Greenland glaciers You can if You want to just look it up what I posted, and I have been in Greenland many times, and have also been inside the Arctic Climate Research Lab, and know exactly what is going on at ground Zero!
However it`s up to You what you rather read,...the bull that the media feeds the public or a shitload of revealing pictures I brought with me form the North Pole, Ellesmere Island and Greenland, feel free to check out my uploaded Album, but I am running out of space there:
http://www.usmessageboard.com/envir...on-stretched-up-to-50-days-2.html#post3240137

I did say, that the only science at play here is "wag the dog" political science, because the "scientific data" is crap and even if You do take the raw data it does not amount to anything...unless You plug that into "Computer Models" and make 100 year projections,...
like form "European Scientists have determined Ocean levels are rising 5/ one hundreds of an inch per year" and then start a media blitz with Pictures like that:
7-most-terrifying-global-warming.jpg


And Al Gores "drowning Polar Bear":
7fbb0d2314e559eebc3f4df58fa50442c5078503


To see how this "science works" just set Your search engine to "images" and You will see that these images come up on top.
Now get Yourself the 'TinEye" reverse Image search plug for the type of browser You are using and trace who is using these images and how much.
Anyway You will be able to track it right down to do a VERY reliable correlation

Next go on "Google insights"...
Google Tendances des recherches

And You will get some REAL insights, after all Google is by far the largest data base and collects all the time who is looking at what with "LSO super cookies" that Your browser DOES NOT get rid off unless You do it manually Yourself!!!
Try "global warming"....and look at the world wide interest trends!
Try "Carbon dioxie" or try CO2...
Try "Global warming"
And this is what You will see:
Google Tendances des recherches

See how Google tracked it world wide...?
#1 is Fiji, #10= Botswana and the U.S. does not even make the list!

Don`t fool Yourself, the Global Warming "Experts" are indeed Experts, not in Science, but certainly in the political Science how to wag the dog...and they are masters in that department!
They do watch these trends more carefully than anything else!
So when they get a spike with their doomsday news press releases and the spike is caused by something like that, which it had...look it up at point marked "F"!..
Slideshow: Fidel Castro says Obama brave on global warming | Reuters.com
r

Fidel Castro praising Obama , brave on global warming
(Reuters) - Former Cuban President Fidel Castro praised President Barack Obama on Wednesday for making a "brave gesture" by speaking out against global warming and saying developed nations had caused much of the damage.

They are not that stupid not to realize why Americans paid attention to Reuters!!!...and that something backfired here!
But nothing halted the downward trend so it is no surprise at all why You don`t see any more high profile press releases about "average temperature" trends.

They don`t want to Target Botswana, they want to target the U.S.!!
Europe has been sacked already!
So they after Al Gore made his movie Google tracked that, here is the "drowning Polar bear"...:
Google Tendances des recherches
There are as You would be able to track with "TinEye" 3 Images associated, that after that wen world wide, #1 Germany, where the "Climate Chancellor" seen to it that every School in Germany has this book...like I say, You can find out with TinEye:
They also have this "drowning Polar Bear"..:
Global-Warming.jpg


But nobody has the Polar Bear I watched all summer and he did not drown!
polarbear-albums-arctic-wildlife-picture3147-polar-bear17.jpg


But this time they did notice, that they scored a huge hit and exactly on target.

Google Tendances des recherches
The U.S. came out at #1...!
See for Yourself!

Soon after that all the CO2, and "average temps" press releases were almost muted and the entire campaign shifted to "thin ice" and the Greenland glacier melts.

Google Tendances des recherches

#1= U.S.,#2=Canada, #3= U.K....!
The biggest peak was a press release, as You can see on that Google graph:
Chunk of greenland glaciers break up overnight

But then that backfired, because other "dissenting" Experts drove that graph down to lower what it was before:
The Hindu : Sci-Tech / Energy & Environment : Chunk of Greenland glacier breaks up overnight
and that was noticed!...again You can track that with Google!
While this week’s breakup itself is not unusual, Howat noted, detecting it within hours and at such fine detail is a new phenomenon for scientists.
So what now...?
Well now we have a press release from Barry Smit to CNN:
"Inuit lives and diets change as ice shifts - CNN
30 Dec 2010 ... Barry Smit, a professor at the University of Guelph, Canada, has spent five years leading research projects into how melting ice and changes ...
articles.cnn.com/.../inuit.impact.climate.change_1_ice-inuit-junk-food?_... - Cached"
story.inuit2.pearce.jpg

Inuit lives and diets change as ice shifts
December 30, 2010|By Catriona Davies for CNN

Climate change is altering diets and lifestyles among Inuit people, according to a scientist who has studied the human face of global warming in the Arctic.

Barry Smit, a professor at the University of Guelph, Canada, has spent five years leading research projects into how melting ice and changes in wildlife habits are impacting the lives and livelihoods of far northern communities.

Among his most striking findings was that increasing difficulty in hunting for traditional food was leading to much more junk food in the Inuit diet.

And a whole lot more of that, that`s been going on for a while:
News
Departing on July 31, from Kuujjuaq in northern Quebec aboard the vessel Polar Ambassador, the 2009 team will explore the northern reaches of Nunavik and southern Baffin Island, Nunavut for close to two weeks. They will return to Ottawa on August 12.

Notice they take the press and these students there at the height of Summer, that is the only time a ship can make it to Baffin Island because the rest of the year you need an icebreaker!
iqaluit2.jpg


And the rest of the "Information Tour" is conducted the same way Communist China or Iran would give You an "Information Tour"...carefully guided:


“Life-changing” trip opens teen’s eyes to climate change
1_000.jpg

Students On Ice participants also approached the then-MP to push for Canada to sign a protocol on the Antarctic Treaty.
Jennifer Castro, 17, left, and Shane McNamara, 18, both of Narragansett, and Rachel Sullivan-Lord, 17, of South Kingstown, left Tuesday for a 15-day scientific expedition to the Arctic Circle, sponsored by Students on Ice.
clip_image001_003.jpg

And yes they all reported what Barry Smit had reported to CNN, how man made GW is "forcing" Inuit to eat Grease burgers.

And now I will show You a few things which were not included in the tour!
and after that You decide what You want to believe!


CBC News In Depth: Aboriginal Canadians
sniff2.jpg

"I can't stop sniffing because I'm very lonely especially when I'm alone... I want to see things I see when I am sniffing," Angela says.
Carl's best friend and brother lies beneath the freshly fallen snow. A little boy named Charles, a little boy lost to the deadly mix of gas and child's play.

Iqaluit_sleeping_175981artw.jpg

trash_iqaluit.jpg

photo_1232982_landscape_large_dossier.jpg

NunatsiaqOnline 2009-12-31: NEWS: Iqaluit: A year in the life of the capital
daisy_curley_police_pic_350.jpg

• RCMP present their final tally for 2008 crime levels to Iqaluit city council, and the picture isn’t pretty. Crime numbers are up across the board, including a 32 per cent jump in theft and property crimes, drug offences rose 86 per cent and traffic offences 72 per cent. Arrests totalled 3,400. Police attribute the spike to increased levels of substance abuse in the capital.
An unsolved homicide: Police have yet to lay in charge in connection with the death of Daisy Curley, 33, whose body was found this past May inside an Iqaluit house.
Drug-related violence also keeps capital RCMP busy. In one incident, a man in his early 30s is brutally beaten by four or five assailants and has to be flown to Ottawa for medical treatment. In another, police seize $1,600 in marijuana and $600 in cash after they break up a brawl in front of Arctic Ventures. One man is pepper sprayed by police, and charged with trafficking, resisting arrest and possession of the proceeds of crime.

Well I could go on and on, because I know Inuvik, I know Iqaluit and I know what goes on in the arctic! "Climatologists" do say the arctic is the best "early warning alarm system"..
And yes if You want to get a scale on this massive fraud, the arctic is indeed the best early warning system what is wrong with modern society!
You want more?
I can get technical too, but have done that already in the other threads here.
 
Hey Polar Bear, you may go on a tad too long, but you're right in that those arguing in favor of special rules are PC rather than science. When too long though, the argument is lost in the details, no matter how right you may be.
 
Thanks for the advice Annie, I took it, so is that short enough?

Of course man made GW, "arctic experts" argue already that our SUV exhaust has ruined the traditional lifestyle of the Inuit peoples.
And if anyone points out that I do not have a degree in Social Science, they are right.
But I have been there and I do not get my info from carefully orchestrated "scientific tours".
If You want to find out what was the cause, all You have to do is look at what the Inuit people say:
Inuit Broadcasting Corporation
It is difficult to describe how shocking the invasion of television to an Arctic community could be. An Inuit woman once described her feelings upon watching “All in the Family” for the first time.

“…There was the father, obviously a stupid man, screaming at his children and his wife. He seemed to hate them. They were lying to him, they were treating with contempt, they were screaming back at him…and then in the last five minutes everyone kissed and made up…We were always taught to treat our elders with respect. I was embarrassed for those people on TV. I thought, I always knew white people were weird. I wondered if that was really what people were like in the South…”

Programming depicting southern attitudes, values and behaviors proliferated in the North throughout the mid-seventies. Inuit and community leaders were quick to realize that this electronic tidal wave of alien images and information would lead to the deterioration of Inuit language and culture, and could disrupt the fragile structures of traditional community life.

And I can tell You, that this is true. You should see how the young punks who are being "educated" with Hollywood and CNN laugh at an elder when he comes by with a dog sled instead of a pick up truck!
Or how they throw anything that`s not at least a Pizza or something from the Iqaluit Burger king in his face...as if You could convince them to eat raw seal meat, like the Professor told CNN, they can`t get "because of man made GWthe ice is too thin"...!

If the American public in the lower 49 only had a more honest media, all this crap would stop OVERNIGHT!
 
Last edited:
I will post the data as it comes in and you can debate it. I don't care if it is right or wrong...I enjoy doing it just like most people enjoy watching fat men throwing a ball around. Different yes, but that is a good thing to have differences in people...If not we would have a very boring word.

Nina and nino decrease and increase the anomalies within their years. The enso is the most powerful short term natural factor in the yearly temperature difference....Outside of a huge volcano of course. So having a much weaker nino and powerful nina is a different set up that favors it to be much below 1998s natural factors anyway.


Yes the UAH measures the lower troposphere...Not saying it is not a good tool to have, but against the surface data?

I thought giss went off of Satellite, buoy, and ship data for their ocean data.

Hadl/Reyn_v2:SST 1880-present
1880-11/1981: Hadley HadISST1, ship and buoy data (Rayner 2000),
12/1981-present: oisst v2, satellite data (Reynolds-Rayner-Smith 2001)
http://data.giss.nasa.gov/gistemp/maps/
 
Last edited:
Man made global warming is a hoax, in respects to modern day fear tactics, that is all it's good for. If anyone really cared to sit down and the science and math they would understand that the world gradually goes through these cycles and there is nothing we can do about it. The myth is further exposed by the fact that the one hacker exposed all those emails of scientists asking other scientists to fudge the date or to get rid of it completely. What some people don't seem to under stand is that "Solar Activity" or a "Volcano" exploding will have much more of a effect on the global climate then we ever will. If you ask any real scientist who isn't interested in political agendas they will tell you that GW is the biggest man made conspiracy to ever brace planet earth next to the Illuminati.
 
Man made global warming is a hoax, in respects to modern day fear tactics, that is all it's good for. If anyone really cared to sit down and the science and math they would understand that the world gradually goes through these cycles and there is nothing we can do about it. The myth is further exposed by the fact that the one hacker exposed all those emails of scientists asking other scientists to fudge the date or to get rid of it completely. What some people don't seem to under stand is that "Solar Activity" or a "Volcano" exploding will have much more of a effect on the global climate then we ever will. If you ask any real scientist who isn't interested in political agendas they will tell you that GW is the biggest man made conspiracy to ever brace planet earth next to the Illuminati.

Sounds just like me a few years ago, but what turned me is the fact that the temperatures haven't went down within the biggest solar minimum in 100 years. :confused: 
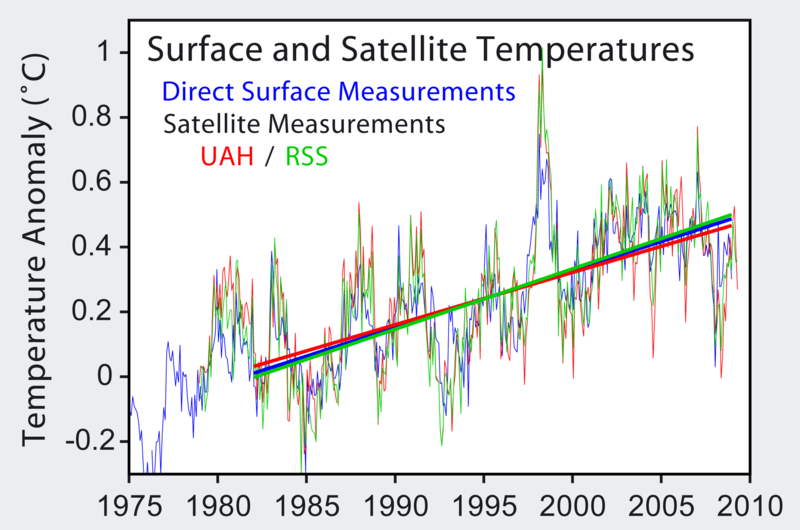
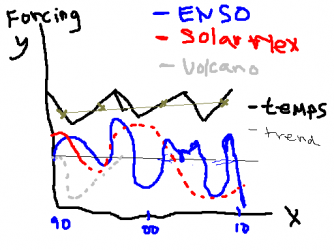
Sure the earth goes through cycles that have to do with the sun...That is a fact, but we are within one of those right now and it is going against it. Why, that is what we are discusing and debating about.

Think about the energy from our star as most of the pie, but then add in the green house gases that holds in the heat...This helps to keep our planet warm and livable, but lets say that you have a increase in the green house gases that causes more of our stars energy to stay within the climate system? So that is going to cause more and more heat stays within our Atmosphere, Oceans(Debateable of course) and ice sheets and causes a imbalance. 93% within oceans....

-Now we have a decrease of solar energy from the norm of the 20th century within solar output reaching our planet. But no decrease in temperature?

-What must of happen you ask? What some believe that has happen is that the energy being holded within the climate system is increasing as the level of forcing per m^2 is increasing with the increase of green house gases...Be it Co2, Ch4, ect. We know that these solar mins have a effect--being that the coldest avg decade since 1880 was 1910s, which had the solar minimum that compares to this one. The thing is this solar max has been weak to, which is compounding the effects and heading us towards a Dalton event, which occurred 1810-1840. It was the last of the grand minimums that made up the Little ice age period. Yes I still believe in the natural stuff I believed as a skeptic. It is very important and the believers are wrong to exclude it. It is part of the forcing that is going to have a huge impact on the rate of the increase within the short and mid term.

-So that(less solar energy) works as a negative forcing against the increasing positive forcing of the co2 and green house gases. Don't believe it then don't;;;Just trying to understand it my self and trying to help others find their way to understanding it better. But anyways they are countering each other right now...Funny thing is when you think about it both have to be compounding and increasing to keep the energy within the climate system to remain stable as it is now. If anything the positive is increasing slightly more then the negative forcing...Which shows that the increase of co2 and green house gases is out powering nature.

Me I don't went a cent gong to anything. Just a interest in knowledge is what I care about.:tongue: Fuck I'm rooting for both sides. I went to see what happens.
 
Last edited:
One of the sad things about this board is how much of the posting has to do with the posters disdain for some political figure. Politics does not change the melting of the glaciers by 1 mm. In fact, each and every time I see a poster yapping about his dislike of one politician or the other on the global warming board, I know that he is not serious about the science at all. In fact, all too often, the poster is willfully ignorant of what the scientists state, and quick to espress his disdain for all scientists.
 
Sounds just like me a few years ago, but what turned me is the fact that the temperatures haven't went down within the biggest solar minimum in 100 years.
-Now we have a decrease of solar energy from the norm of the 20th century within solar output reaching our planet. But no decrease in temperature?

If anything the positive is increasing slightly more then the negative forcing...Which shows that the increase of co2 and green house gases is out powering nature.

Me I don't went a cent gong to anything. Just a interest in knowledge is what I care about.:tongue: Fuck I'm rooting for both sides. I went to see what happens.

No decrease in temperature? What the hell are You talking about? There was and "climatologists" have officially acknowledged that....
What kind of garbage source do You get Your information from?
But "climatologists" have sited everything from 'La Nina" to "reflective dust" in the atmosphere....ANYTHING as long it can evade the subject of solar cycles.
They can`t even agree with their "average temperature highs":
BBC NEWS | Science & Environment | Global temperatures 'to decrease'
Global temperatures for 2008 will be slightly cooler than last year as a result of the cold La Nina current in the Pacific, UN meteorologists have said
_44538809_chinasnowap2226b.jpg

La Nina caused some of the coldest temperatures in memory in China
The WMO points out that the decade from 1998 to 2007 was the warmest on record. Since the beginning of the 20th Century, the global average surface temperature has risen by 0.74C.
While Nasa, the US space agency, cites 2005 as the warmest year, the UK's Hadley Centre lists it as second to 1998.

Rises 'stalled'
Researchers say the uncertainty in the observed value for any particular year is larger than these small temperature differences. What matters, they say, is the long-term upward trend.
[/IMG]

Excuse me?...the uncertainty value in the data they use is LARGER than these "small" temperature differences!

Drop in world temperatures fuels global warming debate | McClatchy

So far this year, the high has been 0.42 degrees Celsius (0.76 degrees Fahrenheit), above the 20-year average, clearly cooler than before.

However, scientists say the skeptics' argument is misleading.

"It's entirely possible to have a period as long as a decade or two of cooling superimposed on the long-term warming trend," said David Easterling, chief of scientific services at NOAA's National Climatic Data Center in Asheville, N.C.

"These short term fluctuations are statistically insignificant (and) entirely due to natural internal variability," Easterling said in an essay published in the journal Geophysical Research Letters in April. "It's easy to 'cherry pick' a period to reinforce a point of view

It does not matter where You look this has been published EVERYWHERE and You have the nerve to say here there was no decrease in temperature!

It does not dawn on You either what they have just admitted about the "accuracy" of their data either has it?

I guess if I put all the dots here, to give You the complete picture of this bullshit dodge maneuver, that will be too many dots for You to connect...so I`ll keep the number of dots to a bare minimum!

"Climatologists" posted that in Wikipedia...NOT me or anybody else:
Global warming - Wikipedia, the free encyclopedia

since the mid-20th century and its projected continuation. According to the 2007 Fourth Assessment Report by the Intergovernmental Panel on Climate Change (IPCC), global surface temperature increased 0.74 ± 0.18 °C (1.33 ± 0.32 °F) during the 20th century.[2][A] Most of the observed temperature increase since the middle of the 20th century has been caused by increasing concentrations of greenhouse gases, which result from human activity

See how lies come back and haunt You...now they are stuck to explain it the same way as they had when they started out!...with "greenhouse gases"!


Climate model projections summarized in the latest IPCC report indicate that the global surface temperature is likely to rise a further 1.1 to 6.4 °C (2.0 to 11.5 °F) during the 21st century.[2] The uncertainty in this estimate arises from the use of models with differing sensitivity to greenhouse gas concentrations and the use of differing estimates of future greenhouse gas emissions.

800px-Satellite_Temperatures.png


Also this "science" allows "scientists" to do things with data presentation that no other science would allow. Trends are of vital importance in a Microprocessor controlled environment. You can`t just draw a straight line through the "averages"...where by the way the noise level is almost twice as high as the magnitude from where You started to record and CONTINUE trying to find a STRAIGHT LINE through your "averages" of the present time!
HOLY SHIT...any control system for a large reaction system would totally overreact and refineries and nuclear power plants would be blowing up all around you!....or stall as it were in this case!
Imagine a large reactor and the cooling system has to take it`s clues from the trend...as they must in a large one..else it falls way behind with catastrophic consequences....also if it OVER MODULATES!
And this is how a REAL trend is established.
I am sure it is necessary to explain to You, that a controller for a large system is not as simple as a controller for a small one, like in a Lab, where instant sensing and response still work, because a small system reacts quicker, there is no lag...but when the system get big, there is a huge lag, so the software has to look at trends..
The software I work with would have spotted a flat trend in the averages from 1980 to 1994. and would have not modulated the cooling system up or down!
Then @ ~ 1994 to about 1998 it would have spotted an ever so slight increase in "heat" and issued a +modulation command to the cooling system.
At 2000 it would sample for the next trend before the software would decide if up or down modulation is required..a REAL Microprocessor trend sensing program would have realized, that there is a flat line in the "de-spiked" data and would neither modulate up or down, because the large system has now stabilized.
I really don`t know what kind of fuck head school these climate computer trend modeling "experts" have attended to put something this stupid into Wikipedia for the entire world to look and laugh at. They should have realized that there are more than a few people out there that can spot this bullshit with the first glance.
I`m just glad the industry does not let them near power plants, large autoclaves, auto pilot software in aviation and so on...else there would be a daily mass carnage.
Even the earliest Westinghouse Microprocessor controls would have spotted these 3 trend zones...I can spot these just by eyeballing, because it is my job to set up control systems for REALLY BIG stuff!
You have no idea how a control system would TOTALLY OVERREACT if You were to feed it this idiotic trend line these "climatologists" have drawn through this graph...
But hey, that`s the whole idea!....that`s the way You were supposed to perceive it like that and it worked!...
Inkblot tests work the same way, if the guy next to You outlines an elephant, then You see an elephant in what was just a simple inkblot.
If it`s too hard for You to look at that graph and ignore this idiotic line just turn on Your printer, issue a screen dump, and trace the same Graph onto a blank sheet of paper and look at it then!
And I`ll connect the other dots for You as well, else Your CPU is a little over burdened.
See they can`t squirm out of that flat Zone from 1998 to 2010 that everybody other than You did spot!

And have to stammer that the "uncertainty" is higher than the fucking B]"increases" [/B]they have presented to the entire world press as accurate data.
And conclude "what is important are the long range trends" and have the audacity to tell You that this long range trend is (still) upwards!...!

You still argue here about temperature trends from which these fraud artists try to quietly distance themselves, since they have been cornered like that IN FRONT OF THE ENTIRE WORLD PRESS...but You have not noticed that for some strange reason and still continue to make a fool of yourself with what they like to call now "uncertainty"...
"climatologists" have walked away from these silly graphs a long time ago!!...now they are trying to prove that the globe is warming with glacier melt ...
You are discussing a dead topic here...the horse and the horse shit left this barn years ago!
 
Last edited:
Also its about time that SOMEBODY finally says this :
People like You get impressed if You see a simple graph which has anywhere in the
picture description the word "NASA" on it, or read an article with something like
"scientists at NASA"...that`s understandable...because You think holy shit, NASA!
They are all "rocket scientists" ,they make satellites, they can land on the moon etc etc...
so this must be right.
Only people that never have worked with or for NASA would be deceived by this!
Do you really think, that a guy who actually works with or designs hi-tech equipment
gives a rat`s ass what some "climatologist" who has permission to access NASA`s vast
resources is doing(as long as he does n`t "shoplift") or saying???...as long
as he is not trying to tell them how to do their job!

haha, I think it has been said actually. NASA's direction has dramatically turned to political correctness in the last few decades and it shows in their output. mind you they still let some unexplainabe work see the daylight, like the study from a few months ago that showed the Urban Heat Island effect was orders of magnitude larger than Jones' claim.
 
While i`m here why not mention this..
Has anyone EVER come across any publication which has a line like "Russian climatologists" in it or anything at all about "man made GW" studies by "RUSSIAN scientists show...".
I bet You have not! and I bet there never will!
If You do Google using a whole variety of combinations all You come up with are western newspaper articles that have on the front page an article about GW and further down a totally unrelated article about Russia or some Russian scientist.
Or Items like this which comes up as # 2 with Google:
Growing Glaciers
The truth about the great overhyped glacier melt ... For the first time ever, Russia is forced to abandon its base at Vostok. Due to heavier than usual pack ...
20 Jan 2010 ... Climate panel?s glacier claims melting away, More holes surface in IPCC?s ... by Russian scientist V. M. Kotlyakov says: “The extrapolar ..

Asia accounts for almost 30% of the total landmass of this planet and yet the "climatologists" don`t even want to mention it!

They have once and probably never will again:
With Google as the #3 hit shows this:
India criticises UN warning on Himalayan glacier melt
India has criticised the UN panel on climate change saying its grim warning about melting Himalayan glaciers was not based on "scientific evidence".
19 Jan 2010 ... India criticises UN warning on Himalayan glacier melt ... Injuries in Easter Island clashes · Russian denies world spam scheme ...

And this too:
Climategate goes SERIAL: now the Russians confirm that UK climate ...
16 Dec 2009 ... The IEA believes that Russian meteorological-station data did not substantiate the anthropogenic global-warming theory. ...

and that`s how it goes on and on down the list of all Google hits using these search criteria, same pattern.

And while I`m here why not mention these too:
With the TinEye reverse image search You would spot who is a "frequent flyer" using this picture:
7-most-terrifying-global-warming.jpg

www.solarpowerwindenergy.org
they also like the "drowning Polar Bear" ....a lot!
You can find "Wordpress" and this bitch almost everywhere when You reverse search these images...and the books she writes and with which Organizations she is:
Heide Cullen

Heide Cullen has written a new book expressing her views about the world’s climate 40 years from now. You may recall that Cullen is the Weather Channel climatologist who suggested that other meteorologists and climatologists who express doubts about anthropogenic global warming be decertified by the American Meteorological Society.
Here is how she answers FAQ`s:
What has the “warmers” so upset?

They get the vast majority of the press and the accolades. They have more money and are highly organized. The “deniers” are mostly a ragtag group of lone individuals motivated by personal interest and receiving zero compensation. They are usually denigrated as kooks or quacks.

The problem is that those some of those ”deniers” have more ability and insight than they are given credit for. Some of them make some pretty good points, uncover some pretty big inconsistencies and exaggerations, and ask some pretty tough questions.

Speaking of “loudly proclaimed confident statements that often have little or no basis,” try this one on for size…
Trenberth’s “future hurricane”
katrina_and_sa_hurricane1.jpg

Today 56 newspapers in 45 countries take the unprecedented step of speaking with one voice through a common editorial. We do so because humanity faces a profound emergency.

Unless we combine to take decisive action, climate change will ravage our planet, and with it our prosperity and security. The dangers have been becoming apparent for a generation. Now the facts have started to speak: 11 of the past 14 years have been the warmest on record, the Arctic ice-cap is melting and last year’s inflamed oil and food prices provide a foretaste of future havoc. In scientific journals the question is no longer whether humans are to blame, but how little time we have got left to limit the damage. Yet so far the world’s response has been feeble and half-hearted.

Some science eeh?

Oh yeah, Sarah Palin who has almost already been convicted by liberals as the telekinetic thought impulse source that twitched a trigger finger does not go unscathed either, she is being held responsible for a massive cover up of dieing Polar Bears as well:

A daily TV/radio news program, hosted by Amy Goodman and Juan Gonzalez, airing on over 900 stations, pioneering the largest community media collaboration in the United States.
Sarah Palin and Global Warming: Alaska Prof. Says Palin Misrepresented State Findings on Endangered Polar Bears...and Tried to Cover It Up

They are even attacking the Canadian Armed Forces:
New info on Operation Nanook, the Canadian military exercise taking place this month in Nunavut?
“Brig. Gen. David Millar, commander of Joint Task Force North, confirmed July 31 that one of the Operation Nanook exercises will simulate the destruction of Iqaluit’s tank farm and fuel boom by environmental activists.”

So, "OldRocks" who are the "kooky" ones?

P.S. You can run TinEye searches here or download the plugin:
http://www.tineye.com/
 
Last edited:
Also its about time that SOMEBODY finally says this :
People like You get impressed if You see a simple graph which has anywhere in the
picture description the word "NASA" on it, or read an article with something like
"scientists at NASA"...that`s understandable...because You think holy shit, NASA!
They are all "rocket scientists" ,they make satellites, they can land on the moon etc etc...
so this must be right.
Only people that never have worked with or for NASA would be deceived by this!
Do you really think, that a guy who actually works with or designs hi-tech equipment
gives a rat`s ass what some "climatologist" who has permission to access NASA`s vast
resources is doing(as long as he does n`t "shoplift") or saying???...as long
as he is not trying to tell them how to do their job!

haha, I think it has been said actually. NASA's direction has dramatically turned to political correctness in the last few decades and it shows in their output. mind you they still let some unexplainabe work see the daylight, like the study from a few months ago that showed the Urban Heat Island effect was orders of magnitude larger than Jones' claim.

Well excuuuuuse me! But that`s not what I was talking about. Because I do know how it works there. The company policy is as You say, but that`s not new and that has been like that almost everywhere else too.
Members of visible minorities actually have the advantage being just that and You tread on very thin ice indeed if You point out any lack in qualifications...
Fags and climatologists are no exception, I knew that and I`m glad You knew too!
 
smoke on this:evil:

1998 was in a solar max and within the strongest nino in record history. 1991-1994 was a period that had the effects of a massive volcano. So that explain why the warming was so neat and visible. Not so in 2000-2010. 2005 did catch the tail of the solar max and had a constant positive enso pattern. 2007-2009 turned to cool with very low solar flex.

That is the way it is.
 

Attachments

  • $forcings2011.PNG
    $forcings2011.PNG
    5.6 KB · Views: 54
Last edited:

Forum List

Back
Top