2009 second warmest year on record

20091005_Figure5.png
http://nsidc.org/images/arcticseaicenews/20091005_Figure5.png

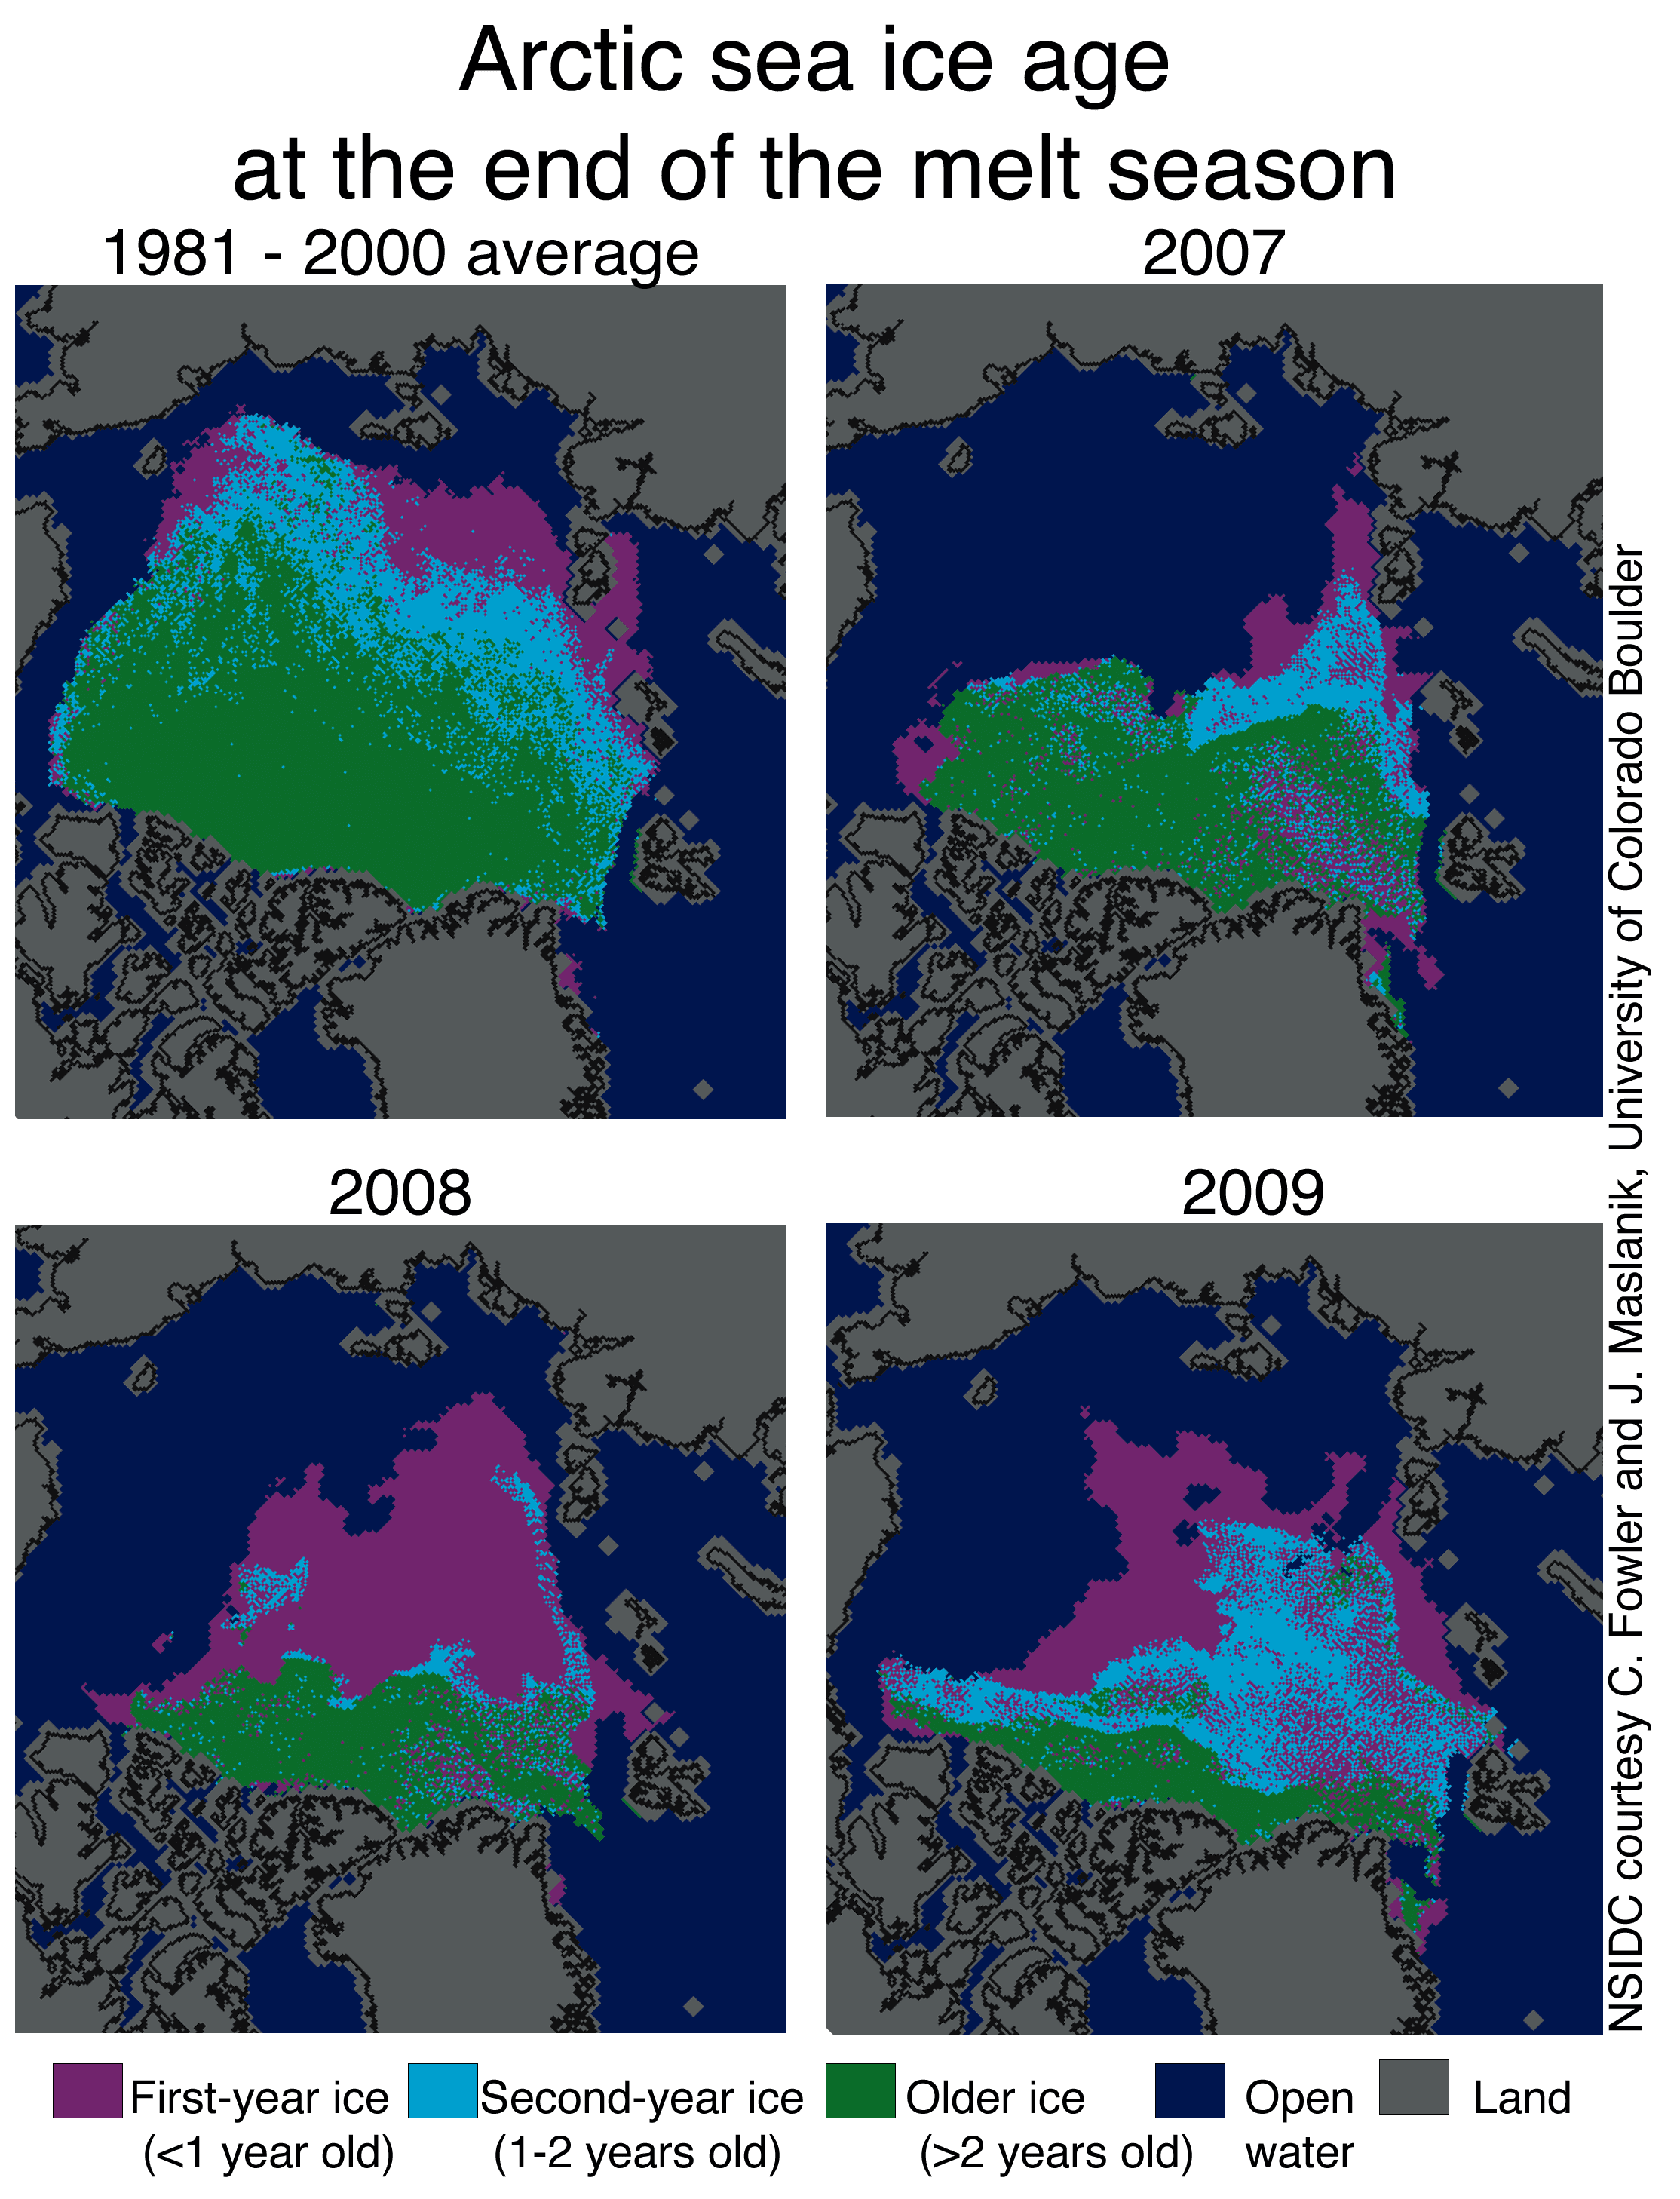
The blue stuff is the SECOND YEAR ice. Compare the amount of SECOND YEAR ice in the 2009 images (released in October 2009) to the amount shown even one year prior.

The ice looks like. it. might. just. be. THICKENING.

There was more second year ice, but far less multiyear ice in 2009. The overall volume of the ice was less in 2009 than in 2008 or 2007.


Sea ice age and thickness

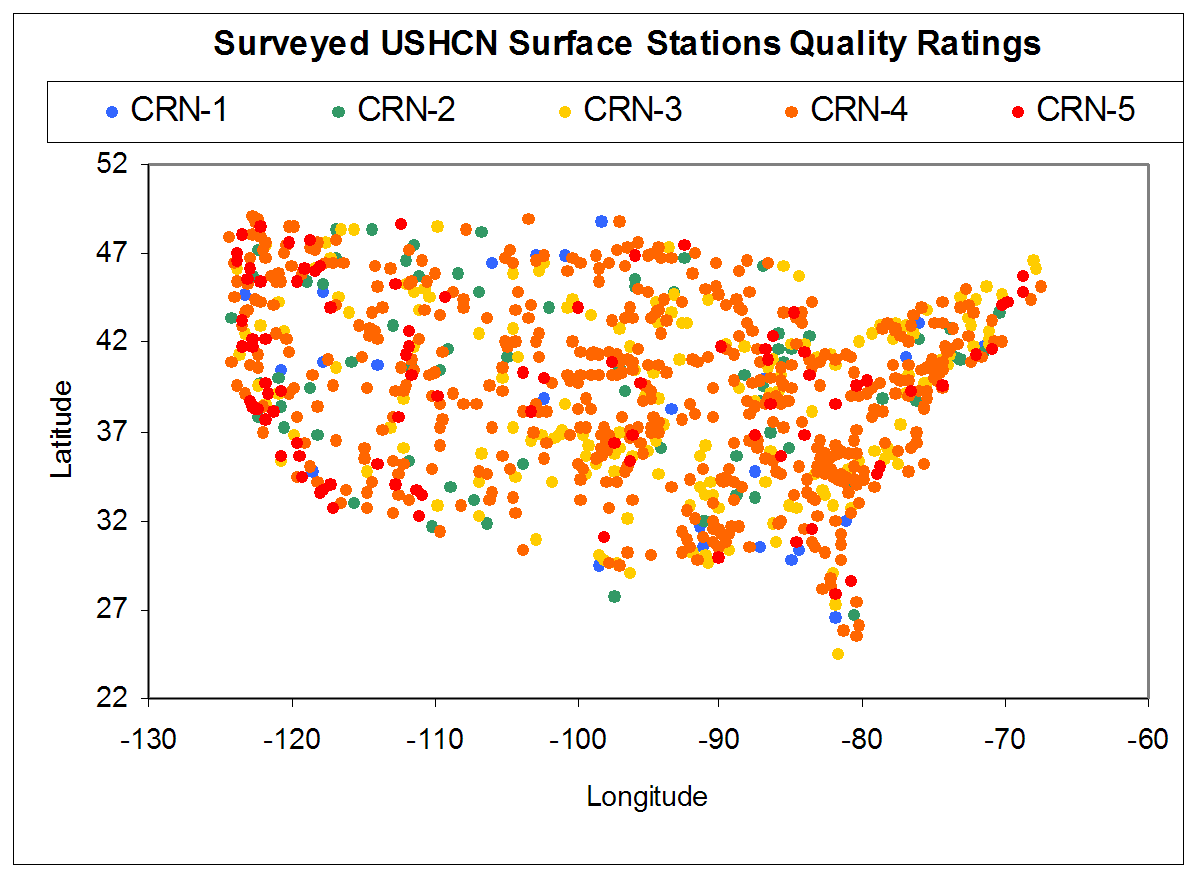
The age of the ice is another key descriptor of the state of the sea ice cover, since older ice tends to be thicker and more resilient than younger ice. A simple two-stage approach classifies sea ice into first year and multiyear ice. First-year is ice that has not yet survived a summer melt season, while multi-year ice has survived at least one summer and can be several years old. Satellite derived maps of ice age for March of 2007, 2008, and 2009 are presented in Figure S3.

Arctic Report Card - Sea Ice Cover - Perovich, et al.

Figure S3. Arctic sea ice distribution in March of 2007, 2008, and 2009. Multiyear ice is in white, mixed ice aqua, first-year ice teal, and ice with melting surface red. Dark blue is for open water and brown for land. From a combination of AVHRR and SSM/I satellite observations and results from drifting ice buoys. (courtesy
of Son Nghiem)

In the past decade, the extent of multiyear sea ice rapidly reduced at a rate of 1.5 x 10⁶ km2 per decade, triple the reduction rate during the three previous decades (1970-2000). Springtime multiyear ice extent was the lowest in 2008 in the QuikSCAT data record since 2000. QuikSCAT results in March 2009 showed a multiyear ice extent of 3.0 ± 0.2 million km2. This was 0.3 million km2 larger than the multiyear ice extent on the same date in 2008, even though the total sea ice extent was similar in the spring of 2008 and 2009. While the multiyear ice extent was similar in March 2008 and 2009, its distribution was quite different. More specifically, in 2008 there was a significant amount of multiyear ice the Beaufort Sea and in 2009 there was a large amount of multiyear ice the central Arctic Ocean.

Recent estimates of Arctic Ocean sea ice thickness from satellite altimetry show a remarkable overall thinning of ~0.6 m in ice thickness between 2004 and 2008 (Figure. S4a). In contrast, the average thickness of the thinner first-year ice in mid-winter (~2 m), did not exhibit a downward trend. Seasonal ice is an important component covered more than two-thirds of the Arctic Ocean in 2008. The total multiyear ice volume in the winter experienced a net loss of more than 40% in the four years since 2005 while the first year ice cover gained volume due to increased overall coverage of the Arctic Ocean. The declines in total volume and average thickness (black line in Figure S4a) are explained almost entirely by thinning and loss of multiyear sea ice due to melting and ice export. These changes have resulted in seasonal ice becoming the dominant Arctic sea ice type, both in terms of area coverage and of volume.

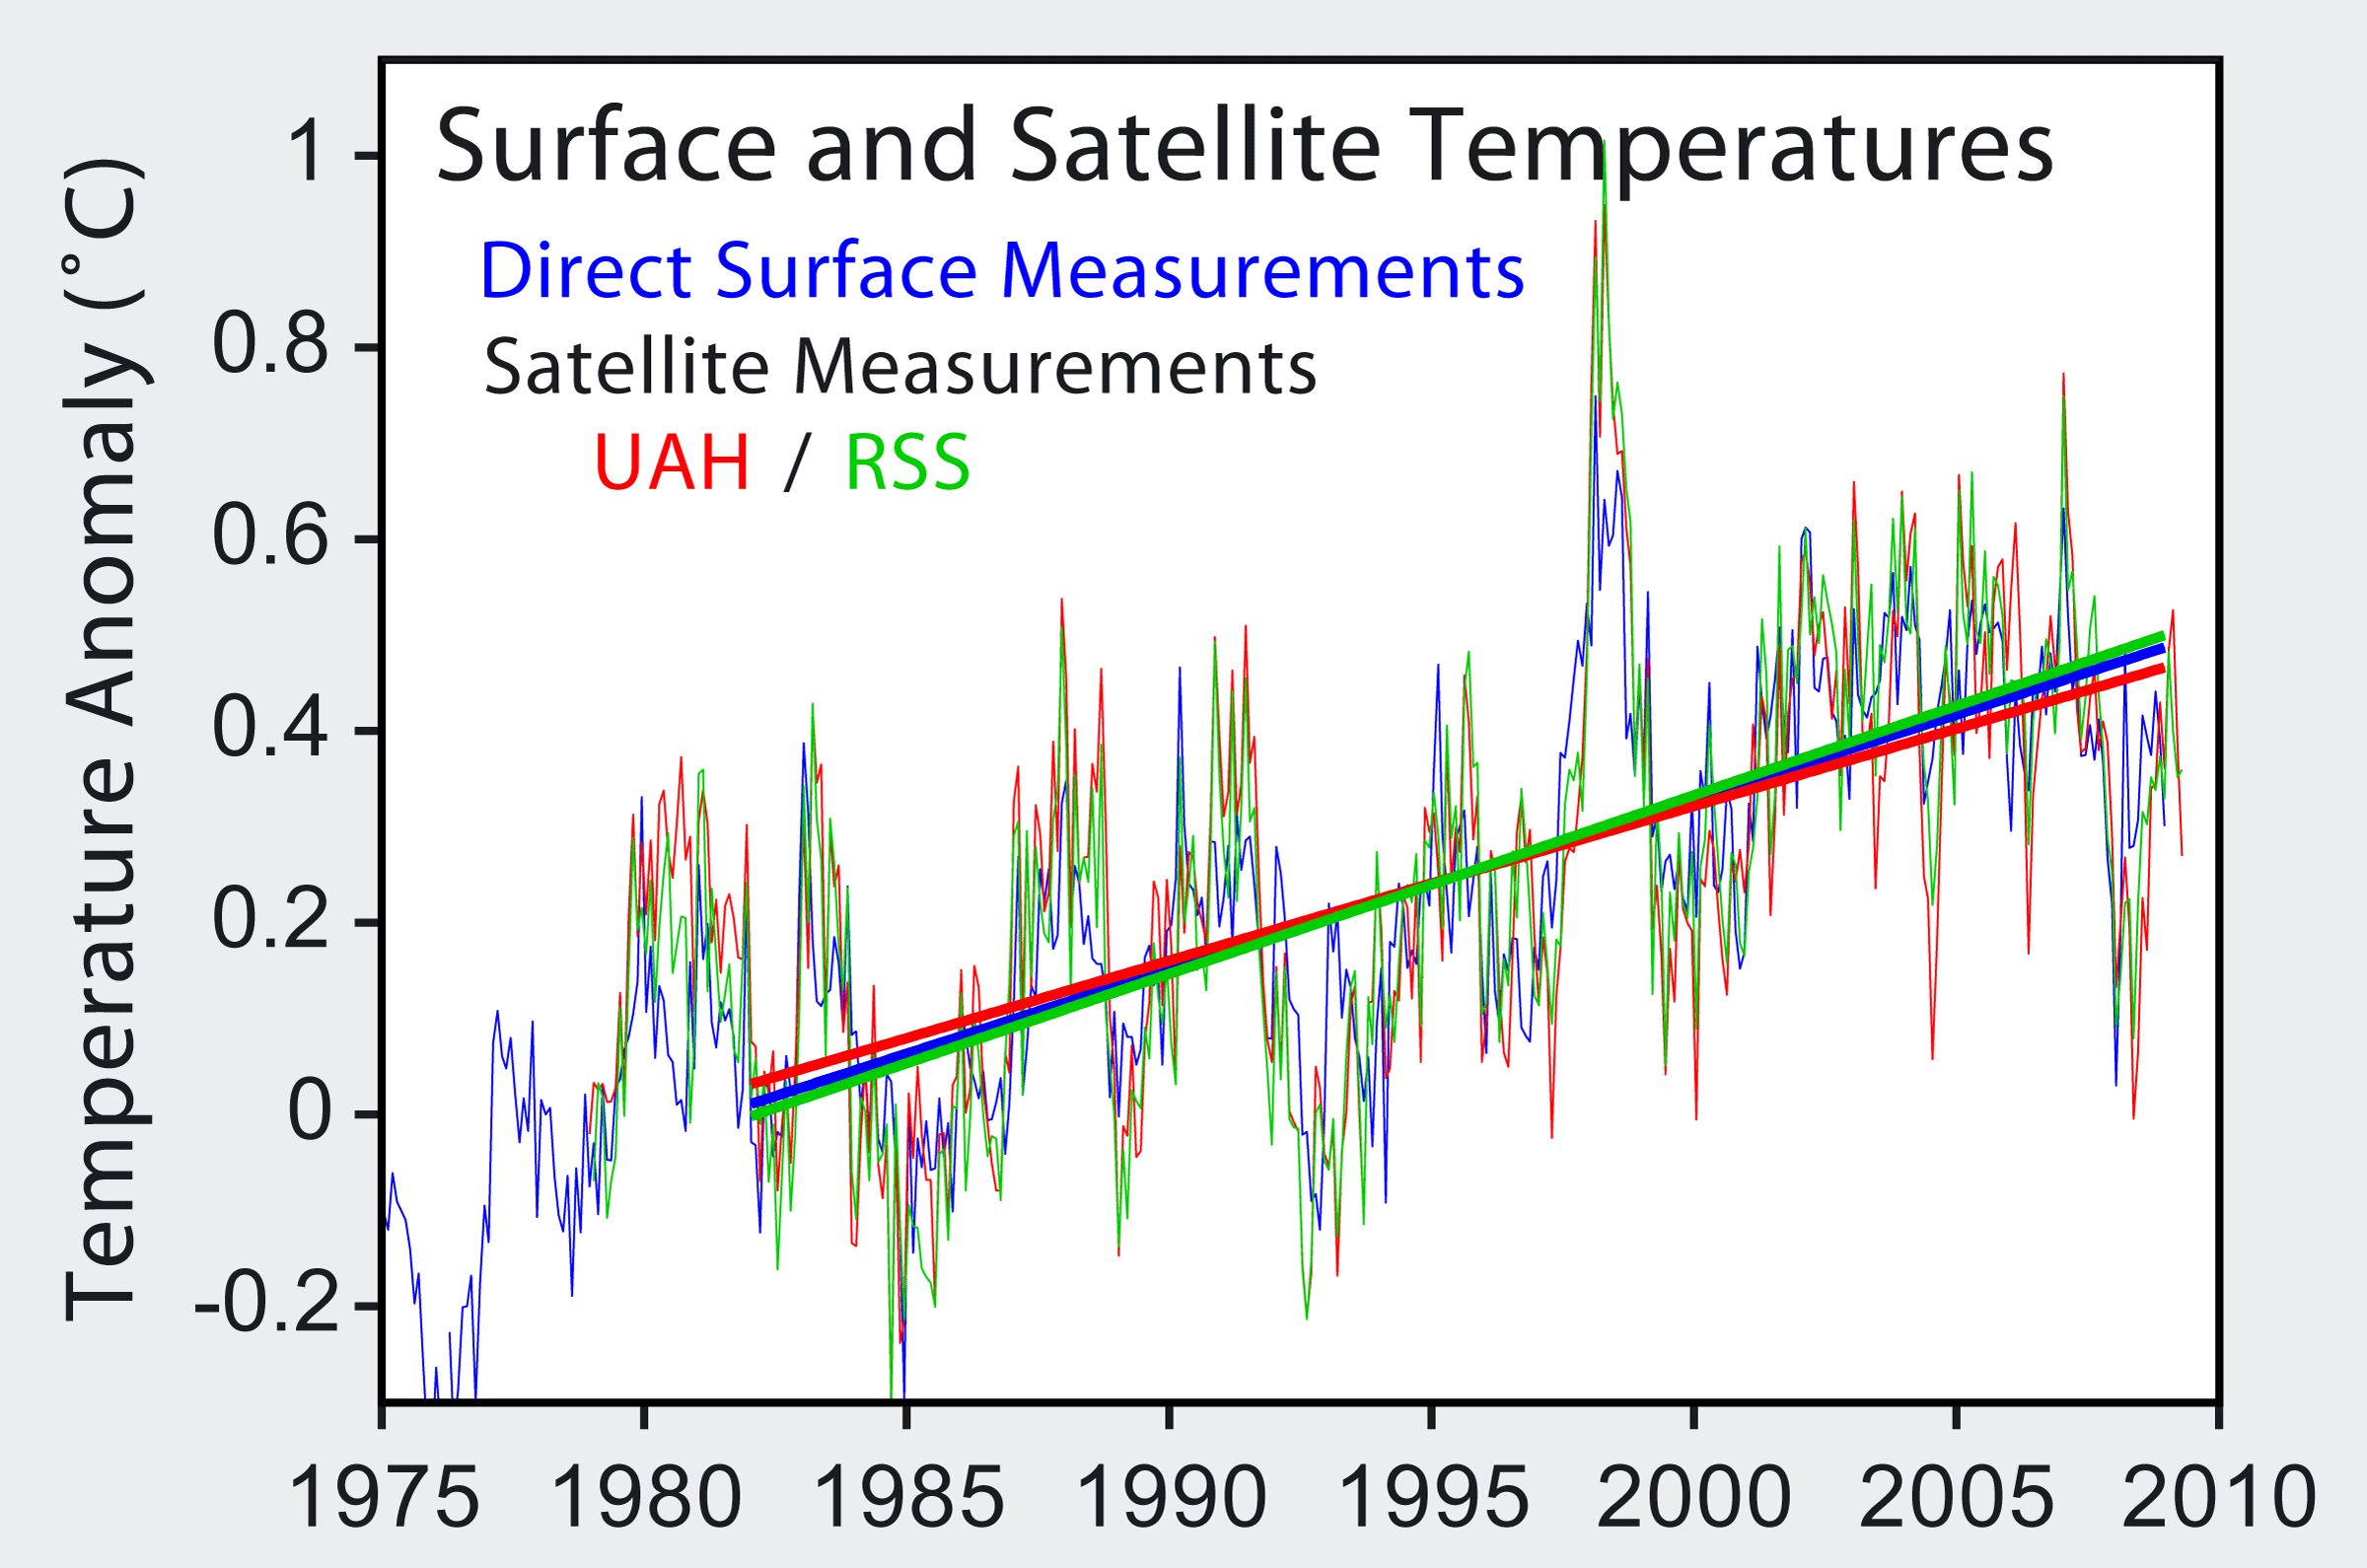
Right now the artic ice is tracking the lowest year on record for area.

Arctic Sea Ice News & Analysis
 
EdtheParrot is back! With a really big nonsensical graph! Like size imports truthiness.

>BARACK!< Anomalies! Anomalies! >Barack oBAMa!<

Ah yes, and Fritz is back with mindless derision instead of a real answer to the accurate data that Ed has presented.
Then I suppose you see the decline in temps that begins in 2001 too?

Decline in temperatures that began in 2001? Are you out of your mind?

The last decade has been the warmest on record. And 2005 was either just a bit warmer or a bit cooler than 1998.

State of the Climate | Global Analysis | Annual 2009

Global Top 10
Warm Years (Jan-Dec) Anomaly °C Anomaly °F
2005 0.62 1.11
1998 0.60 1.08
2003 0.58 1.04
2002 0.57 1.03
2009 0.56 1.01
2006 0.56 1.01
2007 0.55 0.99
2004 0.54 0.97
2001 0.52 0.94
2008 0.48 0.86
1997 0.48 0.86
 
EdtheParrot is back! With a really big nonsensical graph! Like size imports truthiness.

>BARACK!< Anomalies! Anomalies! >Barack oBAMa!<

Ah yes, and Fritz is back with mindless derision instead of a real answer to the accurate data that Ed has presented.
Then I suppose you see the decline in temps that begins in 2001 too?
NO!

It looks like every year except 2008 was WARMER than 2001.
Maybe this chart will help.

get-file.php
 
Ah yes, and Fritz is back with mindless derision instead of a real answer to the accurate data that Ed has presented.
Then I suppose you see the decline in temps that begins in 2001 too?

Decline in temperatures that began in 2001? Are you out of your mind?

The last decade has been the warmest on record. And 2005 was either just a bit warmer or a bit cooler than 1998.

State of the Climate | Global Analysis | Annual 2009

Global Top 10
Warm Years (Jan-Dec) Anomaly °C Anomaly °F
2005 0.62 1.11
1998 0.60 1.08
2003 0.58 1.04
2002 0.57 1.03
2009 0.56 1.01
2006 0.56 1.01
2007 0.55 0.99
2004 0.54 0.97
2001 0.52 0.94
2008 0.48 0.86
1997 0.48 0.86
AAAannd cue the referencing of more bad data. LOL.
 
Then I suppose you see the decline in temps that begins in 2001 too?
ANOMALY!...ANOMALY!...ANOMALY!...>BARACK!< :lol::lol::lol::lol:
Another BRILLIANT rebuttal.
You CON$ keep outdoing yourselves. :rofl:
Well, when you actually stop presenting the exact same charts and bullshit that nobody but insane chicken littles believes, we'll stop making Progressive Parrot noises every time you show up.
 
I see. So if reality disagrees with you, call reality bad data.

Liability kindly provided some nice pictures and graphs that competely refute your claim of bad data.

Face it, all you have is drugged out radio jocks, and paid for whores on your side of this debate. And every year now shows the idiocy that you indulge in by putting ideology ahead of evidence.
How's that IPCC doing? Been able to accept their admissions they have been lying for years, yet?
 
Hey! Let's have fun posting data!

Watts_fig21.png

crn_ratings.png

Watts_fig23.png


And you expect me to trust the data you're getting?
 
Here is a well maintained and well sited USHCN station:
OrlandCA_USHCN_Site_small.jpg


Here is a not-so-well maintained or well sited USHCN station:
MarysvilleCA_USHCN_Site_small.jpg
 
And these stations are causing the glacier in Glacier National Park to disappear? They are creating the conditions that have been reducing the total volume of the Arctic Ice Cap far beyond even the most pessimist alarmist prediction?

Yes, just keep babbling on with you dingbat talking points, while the temperatures continue to climb, and the ice continues to disappear.
 
You can't teach an Old Crock new tricks, but you can beat it repeatedly with a newspaper. :rolleyes:

You know Crocks, you are finally reaching the point where you have no more entertainment value left in your religion.

I now understand why people ignore crazy end of the world babblers on street corners. They're just not worth the effort.
 
The best thing about the Arctic or Greenland deglaciating will be when signs of major human civilizations are uncovered.

The revelation of prior human civilizations will truly rattle the libs, especially the cool things they discovered and preserved before the onset of perfectly natural global cooling.

This little warming treend may not last forever, though.

I wonder if the interglacial period we've BEEN in is nearing an end?
 
Moldy socks:

I note with amusement that you ducked my question. DO you or do you not accept that there is evidence of recent arctic ice thickening?

And, what of the latest data suggesting that the summer melt-off is the lowest since such measurements started getting made by satellites?

The ice melt across during the Antarctic summer (October-January) of 2008-2009 was the lowest ever recorded in the satellite history.

* * * * Such was the finding reported last week by Marco Tedesco and Andrew Monaghan in the journal Geophysical Research Letters:

A 30-year minimum Antarctic snowmelt record occurred during austral summer 2008–2009 according to spaceborne microwave observations for 1980–2009. Strong positive phases of both the El-Niño Southern Oscillation (ENSO) and the Southern Hemisphere Annular Mode (SAM) were recorded during the months leading up to and including the 2008–2009 melt season.

Antarctica_icemelt.JPG


Figure 1. Standardized values of the Antarctic snow melt index (October-January) from 1980-2009 (adapted from Tedesco and Monaghan, 2009).

The silence surrounding this publication was deafening.

* * * *
World Climate Report Antarctic Ice Melt at Lowest Levels in Satellite Era

Do you always argue against yourself?

The lowest melt on record. But still a decrease. A decrease that we will not get back. And the sea level rise continues on the upper edge of the probablity cone from the estimate in 2006.

Had you a real case, there would have been in increase in the amount of ice from the low of 2007 to the low of 2008, 2009. Instead, we see continued diminishment of the Antarctic Ice Cap, a diminishment measured in giga-tons of ice, even in the melt seasons of 2008 and 2009.

Ice melts in the summer?

Fuck.

Who knew?

But the ice melted LESS. And the SECOND YEAR ICE (i.e., the ice that made it through an entire prior melting cycle) increased.

So, no. Nobody (not even you) believes I am arguing "against" myself. That cheap comment by you was nothing but a deliberate lie.

Tsk tsk.

It's sad when a man of faith, like you, demonstrates so litle faith. This does tend to explain, however, why you AGW Faithers resort to manipulation and concealment of data. You remain hostile to the fundamental precepts of good science and hostile to honesty itself.
 
I see. So if reality disagrees with you, call reality bad data.

Liability kindly provided some nice pictures and graphs that competely refute your claim of bad data.

Face it, all you have is drugged out radio jocks, and paid for whores on your side of this debate. And every year now shows the idiocy that you indulge in by putting ideology ahead of evidence.

Except, the images I shared do not at all refute the claim of bad data.

It just so happens that the data itself used for those images is superior to the altered and suppressed data favored by the AGW Faither Clergy.
 

Forum List

Back
Top