2009 second warmest year on record

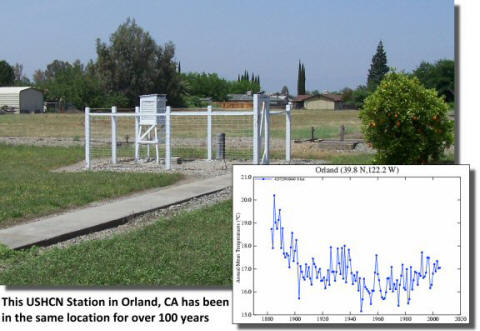
Here is a well maintained and well sited USHCN station:
OrlandCA_USHCN_Site_small.jpg


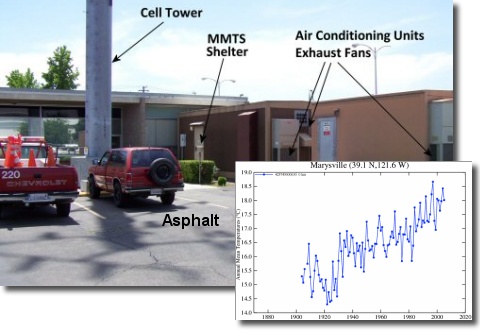
Here is a not-so-well maintained or well sited USHCN station:
MarysvilleCA_USHCN_Site_small.jpg

Are you crazy big fitz?

The Man Made Global Warming Religion has nothing to do with truth, stop trying to prove our lord Gore is wrong or you will go to hell where there is no recycling and its really fucking hot.
 
:eusa_whistle:

The assumption in all these stories that report on the Wilkins Ice Shelf, and other melting ice around the Antarctic Peninsula, is that global warming is the cause, and that they are representative of a general melt occurring throughout Antarctica. And if this were true, this would be alarming, since 90% of the world’s land based ice is in Antarctica. So is the ocean warming around Antarctica, and is Antarctica’s overall total mass decreasing?


GLOBAL SEA SURFACE TEMPERATURE ANOMALY – APRIL 2009

blog_antarctic09-2.jpg


As of April 2009, sea surface temperatures surrounding
Antarctica are mostly colder than average.
(Image: NOAA)


The answer to both of these questions is almost certainly no. As this recent imagery from NOAA indicates, the southern ocean is actually colder than average. Except for a few areas directly south of the Indian Ocean, and in the area south of Patagonia and surrounding the Antarctic Peninsula, the rest of the ocean surrounding Antarctica – virtually all of the South Pacific and South Atlantic – is cooler than average. This data indicates no reason to believe ocean temperatures are causing overall loss of ice mass in the Antarctic; with the exception of the insignificant quantity of ice on the Antarctic Peninsula, they suggest the opposite.


CURRENT SOUTHERN HEMISPHERE SEA ICE AREA

blog_antarctic09-1.jpg


As of May 2009, sea ice surrounding Antarctica is
about 1.0 million square kilometers greater than average.
(Image: University of Illinois)


What about the ice mass of Antarctica? Along with land based ice, which can raise sea levels when melted into the ocean, another significant indicator of polar temperature is the extent of floating sea ice. As the above table prepared by researchers at the University of Illinois indicates, the actual sea ice surrounding Antarctica is well above average. The black line represents the last 12 months of sea ice area, based on satellite data. You can see the sea ice reached a peak of 15 million square kilometers around September, during the peak of the southern winter. You can see it dropped to a low of 2 million square kilometers in mid-February, at the height of the southern summer. Currently the sea ice surrounding Antarctica is 7 million square kilometers and rising. The red line, however, is what is significant, because the red line indicates whether or not the sea ice is above or below the historical norm. And as you can see, as of May 2009, Antarctic sea ice is about 1.0 million square kilometers above normal.

Just like last year, to assist in the research for this post I contacted Dr. Roger Pielke Sr., a climatologist at the University of Colorado whose blog www.climatesci.org is one of the most balanced forums and respected sources of technical information on global climate anywhere. In response to my inquiry, he wrote the following: “The sea ice around the continent is far above average (ref. UIUC). Also, note the colder than average sea surface temperatures around Antarctic (ref. NOAA). If the media is going to discuss the Wilkens Ice Shelf, they should also discuss this other data. The expansion of the sea ice coverage implies a cooling.”


The Real Facts on Increasing Antarctic Ice
 
Not accurate liability.

Arctic Sea Ice News & Analysis


February 3, 2010
Despite cool temperatures, ice extent remains low

Despite cool temperatures over most of the Arctic Ocean in January, Arctic sea ice extent continued to track below normal. By the end of January, ice extent dropped below the extent observed in January 2007. Ice extent was unusually low in the Atlantic sector of the Arctic, the one major area of the Arctic where temperatures remained warmer than normal.


Arctic sea ice reflects sunlight, keeping the polar regions cool and moderating global climate. According to scientific measurements, Arctic sea ice has declined dramatically over at least the past thirty years, with the most extreme decline seen in the summer melt season.

Read timely scientific analysis year-round below. We provide an update during the first week of each month, or more frequently as conditions warrant.

Please credit the National Snow and Ice Data Center for image or content use unless otherwise noted beneath each image.


:eusa_whistle:

The assumption in all these stories that report on the Wilkins Ice Shelf, and other melting ice around the Antarctic Peninsula, is that global warming is the cause, and that they are representative of a general melt occurring throughout Antarctica. And if this were true, this would be alarming, since 90% of the world’s land based ice is in Antarctica. So is the ocean warming around Antarctica, and is Antarctica’s overall total mass decreasing?


GLOBAL SEA SURFACE TEMPERATURE ANOMALY – APRIL 2009

blog_antarctic09-2.jpg


As of April 2009, sea surface temperatures surrounding
Antarctica are mostly colder than average.
(Image: NOAA)


The answer to both of these questions is almost certainly no. As this recent imagery from NOAA indicates, the southern ocean is actually colder than average. Except for a few areas directly south of the Indian Ocean, and in the area south of Patagonia and surrounding the Antarctic Peninsula, the rest of the ocean surrounding Antarctica – virtually all of the South Pacific and South Atlantic – is cooler than average. This data indicates no reason to believe ocean temperatures are causing overall loss of ice mass in the Antarctic; with the exception of the insignificant quantity of ice on the Antarctic Peninsula, they suggest the opposite.


CURRENT SOUTHERN HEMISPHERE SEA ICE AREA

blog_antarctic09-1.jpg


As of May 2009, sea ice surrounding Antarctica is
about 1.0 million square kilometers greater than average.
(Image: University of Illinois)


What about the ice mass of Antarctica? Along with land based ice, which can raise sea levels when melted into the ocean, another significant indicator of polar temperature is the extent of floating sea ice. As the above table prepared by researchers at the University of Illinois indicates, the actual sea ice surrounding Antarctica is well above average. The black line represents the last 12 months of sea ice area, based on satellite data. You can see the sea ice reached a peak of 15 million square kilometers around September, during the peak of the southern winter. You can see it dropped to a low of 2 million square kilometers in mid-February, at the height of the southern summer. Currently the sea ice surrounding Antarctica is 7 million square kilometers and rising. The red line, however, is what is significant, because the red line indicates whether or not the sea ice is above or below the historical norm. And as you can see, as of May 2009, Antarctic sea ice is about 1.0 million square kilometers above normal.

Just like last year, to assist in the research for this post I contacted Dr. Roger Pielke Sr., a climatologist at the University of Colorado whose blog www.climatesci.org is one of the most balanced forums and respected sources of technical information on global climate anywhere. In response to my inquiry, he wrote the following: “The sea ice around the continent is far above average (ref. UIUC). Also, note the colder than average sea surface temperatures around Antarctic (ref. NOAA). If the media is going to discuss the Wilkens Ice Shelf, they should also discuss this other data. The expansion of the sea ice coverage implies a cooling.”


The Real Facts on Increasing Antarctic Ice
 
Last edited:
Not accurate.

Arctic Sea Ice News & Analysis


February 3, 2010
Despite cool temperatures, ice extent remains low

Despite cool temperatures over most of the Arctic Ocean in January, Arctic sea ice extent continued to track below normal. By the end of January, ice extent dropped below the extent observed in January 2007. Ice extent was unusually low in the Atlantic sector of the Arctic, the one major area of the Arctic where temperatures remained warmer than normal.


Arctic sea ice reflects sunlight, keeping the polar regions cool and moderating global climate. According to scientific measurements, Arctic sea ice has declined dramatically over at least the past thirty years, with the most extreme decline seen in the summer melt season.

Read timely scientific analysis year-round below. We provide an update during the first week of each month, or more frequently as conditions warrant.

Please credit the National Snow and Ice Data Center for image or content use unless otherwise noted beneath each image.


:eusa_whistle:

The assumption in all these stories that report on the Wilkins Ice Shelf, and other melting ice around the Antarctic Peninsula, is that global warming is the cause, and that they are representative of a general melt occurring throughout Antarctica. And if this were true, this would be alarming, since 90% of the world’s land based ice is in Antarctica. So is the ocean warming around Antarctica, and is Antarctica’s overall total mass decreasing?


GLOBAL SEA SURFACE TEMPERATURE ANOMALY – APRIL 2009

blog_antarctic09-2.jpg


As of April 2009, sea surface temperatures surrounding
Antarctica are mostly colder than average.
(Image: NOAA)


The answer to both of these questions is almost certainly no. As this recent imagery from NOAA indicates, the southern ocean is actually colder than average. Except for a few areas directly south of the Indian Ocean, and in the area south of Patagonia and surrounding the Antarctic Peninsula, the rest of the ocean surrounding Antarctica – virtually all of the South Pacific and South Atlantic – is cooler than average. This data indicates no reason to believe ocean temperatures are causing overall loss of ice mass in the Antarctic; with the exception of the insignificant quantity of ice on the Antarctic Peninsula, they suggest the opposite.


CURRENT SOUTHERN HEMISPHERE SEA ICE AREA

blog_antarctic09-1.jpg


As of May 2009, sea ice surrounding Antarctica is
about 1.0 million square kilometers greater than average.
(Image: University of Illinois)


What about the ice mass of Antarctica? Along with land based ice, which can raise sea levels when melted into the ocean, another significant indicator of polar temperature is the extent of floating sea ice. As the above table prepared by researchers at the University of Illinois indicates, the actual sea ice surrounding Antarctica is well above average. The black line represents the last 12 months of sea ice area, based on satellite data. You can see the sea ice reached a peak of 15 million square kilometers around September, during the peak of the southern winter. You can see it dropped to a low of 2 million square kilometers in mid-February, at the height of the southern summer. Currently the sea ice surrounding Antarctica is 7 million square kilometers and rising. The red line, however, is what is significant, because the red line indicates whether or not the sea ice is above or below the historical norm. And as you can see, as of May 2009, Antarctic sea ice is about 1.0 million square kilometers above normal.

Just like last year, to assist in the research for this post I contacted Dr. Roger Pielke Sr., a climatologist at the University of Colorado whose blog www.climatesci.org is one of the most balanced forums and respected sources of technical information on global climate anywhere. In response to my inquiry, he wrote the following: “The sea ice around the continent is far above average (ref. UIUC). Also, note the colder than average sea surface temperatures around Antarctic (ref. NOAA). If the media is going to discuss the Wilkens Ice Shelf, they should also discuss this other data. The expansion of the sea ice coverage implies a cooling.”


The Real Facts on Increasing Antarctic Ice

You must be an initiate into the AGW Faither's Religion. You will likely be called upon to do penance now.

You just attempted to refute scientifically based assertions regarding ANTARCTIC cooling by citing to some material about ARCTIC warming.

:lol:
 
Western Washington has experienced the warmest January on record. The temperature never fell below freezing. Typically January is the coldest month for our part of the country with temps averaging and varying between 0 deg and 40 deg the whole month.
 
The Antarctic Sea Ice has had a slight increase in the last 30 years on the average. At present it is almost exactly at the mean of the last 30 years. Within the normal variation of the yearly sea ice, it has been quite stable within that period, unlike the Arctic, which as declined precipitously.

http://arctic.atmos.uiuc.edu/cryosphere/IMAGES/seaice.anomaly.antarctic.png

The overall global sea ice is in a rapid decline, as can be seen in this graph;

http://arctic.atmos.uiuc.edu/cryosphere/IMAGES/global.daily.ice.area.withtrend.jpg
Dear Mr. Rocks in the Head,

It has been brought to the attention of our department that you are possessed of the belief that the world is warming in preparation to a global catastrophe and that only human action can prevent said catastrophe. If as some have suggested you are too willfully stupid then feel free to disregard this missive as it is solely politeness, and an interest in combating rampant ignorance, which induces us to send you this information.
You are wrong. Though the Earth may be heating in some areas, a claim itself subject to refutation, the possibility of catastrophic climate change is in fact nonexistent. A billion years ago the earth was, on average, far warmer than today; while such tropical temperatures would be considered balmy by some, they would fall far short of any catastrophe. The earliest epochs also saw warmer temperatures, and in those eras none of the carbon trapped by the formation of 'fossil' fuels has been removed from the general environment. That still did not lead to runaway greenhouse effects as one sees on Venus.
So you see, there is nothing to worry about.

Sincerely,
A group of people, each with more scientific understanding than you can ever hope to equal.
 
The Antarctic Sea Ice has had a slight increase in the last 30 years on the average. At present it is almost exactly at the mean of the last 30 years. Within the normal variation of the yearly sea ice, it has been quite stable within that period, unlike the Arctic, which as declined precipitously.

http://arctic.atmos.uiuc.edu/cryosphere/IMAGES/seaice.anomaly.antarctic.png

The overall global sea ice is in a rapid decline, as can be seen in this graph;

http://arctic.atmos.uiuc.edu/cryosphere/IMAGES/global.daily.ice.area.withtrend.jpg
Dear Mr. Rocks in the Head,

It has been brought to the attention of our department that you are possessed of the belief that the world is warming in preparation to a global catastrophe and that only human action can prevent said catastrophe.

Quite on the contrary. There is no human action that can prevent the catastrophe that is already in the pipeline. What can be done is to prevent it from being worse that it has to be. But that too, is not going to happen. People like yourself will prevent anything from being done.

If as some have suggested you are too willfully stupid then feel free to disregard this missive as it is solely politeness, and an interest in combating rampant ignorance, which induces us to send you this information.

I have yet to see anything to indicate that you have more than a two digit IQ.


You are wrong.

Your proof of which is?

Though the Earth may be heating in some areas, a claim itself subject to refutation, the possibility of catastrophic climate change is in fact nonexistent.

Then provide that refutation from source that competant in the field of climatology.

A billion years ago the earth was, on average, far warmer than today; while such tropical temperatures would be considered balmy by some, they would fall far short of any catastrophe.

Look, dimwit, within the 4.5+ billion years that this planet has existed, it has had periods in which it warmed extremely fast, and killed 95% of the species then existant. It has also had period when the oceans froze almost to the equator.

You should learn a bit about the geological history of this planet before you propose to lecture me, or anyone else, on that history.


The earliest epochs also saw warmer temperatures, and in those eras none of the carbon trapped by the formation of 'fossil' fuels has been removed from the general environment.

???? Due to the construction of that sentence, I will have to assume that you mean that none of the sequestered carbon of that period was released to create the warmer period.

Well, you are completely wrong.

Methane clathrate - Wikipedia, the free encyclopedia
Methane clathrates and climate change
Main article: Clathrate gun hypothesis
Methane is a powerful greenhouse gas. Despite its short atmospheric half life of 7 years, methane has a global warming potential of 62 over 20 years and 21 over 100 years (IPCC, 1996; Berner and Berner, 1996; vanLoon and Duffy, 2000). The sudden release of large amounts of natural gas from methane clathrate deposits has been hypothesized as a cause of past and possibly future climate changes. Events possibly linked in this way are the Permian-Triassic extinction event, the Paleocene-Eocene Thermal Maximum.

Climate scientists such as James E. Hansen expect that methane clathrates in the permafrost regions will be released as a result of global warming, unleashing powerful feedback forces which may cause runaway climate change that cannot be controlled (presuming that climate change could be controlled in any case).

Recent research carried out in 2008 in the Siberian Arctic has shown millions of tons of methane being released[25][26][27][28][29] with concentrations in some regions reaching up to 100 times above normal.[30][31]


That still did not lead to runaway greenhouse effects as one sees on Venus.
So you see, there is nothing to worry about.

A minor release of GHGs, CH4 and CO2, created the Paleocene, Eocene
Thermal Maximum, and resulted in the extinction of 20% of the species then on Earth.


Sincerely,
A group of people, each with more scientific understanding than you can ever hope to equal.

Fellow, your knowledge of science is scant, and your understanding nil.
 
Western Washington has experienced the warmest January on record. The temperature never fell below freezing. Typically January is the coldest month for our part of the country with temps averaging and varying between 0 deg and 40 deg the whole month.

Well, there you have it....spoken by huggy. That means global warming for sure.
But,.....back east it is one of the worst winters remembered....go figure.
 
Been an interesting year for sure. While the East Coast was freezing in that last storm, temperatures in the Arctic were 10 or more degrees above normal. And in central Greenland, over 20 degrees above normal.

Right now, where I am at, our daffodils are over a foot high, the tulips are 6 to 8 inchs. And we had just two weeks of cold weather so far this year. About 55 degrees, midday today, and predicted to be in the low and mid fifties as far as they can see down the road.

Analomous weather all over.

And last year, hmmm?
 
Western Washington has experienced the warmest January on record. The temperature never fell below freezing. Typically January is the coldest month for our part of the country with temps averaging and varying between 0 deg and 40 deg the whole month.

Well, there you have it....spoken by huggy. That means global warming for sure.
But,.....back east it is one of the worst winters remembered....go figure.
Not my part of the East. We had about 2 weeks of cold weather from a little before Christmas to a little after New Years. Normally by this time I've used between 120 and 140 gallons of kerosene but I've used only 66.7 gallons so far, the least I've ever used and I've been in this same house over 35 years.
 
The Antarctic Sea Ice has had a slight increase in the last 30 years on the average. At present it is almost exactly at the mean of the last 30 years. Within the normal variation of the yearly sea ice, it has been quite stable within that period, unlike the Arctic, which as declined precipitously.

http://arctic.atmos.uiuc.edu/cryosphere/IMAGES/seaice.anomaly.antarctic.png

The overall global sea ice is in a rapid decline, as can be seen in this graph;

http://arctic.atmos.uiuc.edu/cryosphere/IMAGES/global.daily.ice.area.withtrend.jpg

Did you mean to post something else for the "Rapid decline chart"?

No. He considers a graph depicting almost no detectable change over a period of over 30 years to be indicative of a RAPID DECLINE!

:lol:
 
Sadly, most of that "heat" was recorded over the Oceans and not on the land that is covered with ice and snow. In some places, its record ice and snow. Sure hope this is not the begining of a new ice age. In the past when the Climate started to change, the weather changed on a dime.
 
Last edited:
Sadly, most of that "heat" was recorded over the Oceans and not on the land that is covered with ice and snow. In some places, its record ice and snow. Sure hope this is not the begining of a new ice age. In the past when the Climate started to change, the weather changed on a dime.
Yeah? Still not man's fault and man can do nothing to stop or change it.

Fundamental flaw to all the warmist theory. They can't conclusively prove man causes it.

Everyone knows the weather changes. It's the nature of the beasty.

I think too many have forgotten that this whole argument is not over the fact that the weather change, but in stopping/creating a fascist green state over the entire globe for a non-existent crisis.
 
Fellow, your knowledge of science is scant, and your understanding nil.
So you’re a better scientist than I am.
Prove it.
Not with some pretentious claim of a PhD, but with an answer to a real question.
One actually related to abating human CO2 production.

CO2, as you should be aware, is produced when humans combust various carbon compounds to create usable energy. Two methods which might reduce CO2 production are change human behavior, or increase the amount of usable energy from combustion. Dr Mike Stickney of MCI has been working with British Oil on a method of chemical synthesis using a combustion shock tube. British Oil’s research interest is obtaining a less expensive method of reducing CO emissions, but the data from Stickney’s research is still of interest to the serious physicist.

The combustion shock tube consists of a long tube filled with combustible gas which when ignited produced a supersonic shock wave which accelerates down the tube. Dr. Stickney used CO and H2O to obtain CO2 and H2. Unlike the previous research, done back in the mid 20th century, Stickney used a closed tube with a precise mix of gasses to provide complete combustion of the CO. Two items of interest were found; first the chemical potential energy was converted to mechanical energy at rates exceeding 85% efficiency, second the shock wave left a vacuum in its wake. The high efficiency is of interest to anyone trying to conserve resources or reduce CO2 emissions, but the vacuum is on interest to the physicist.

Ahh, the vacuum. Think for a moment; the tube is initially filled with gas at equilibrium. A spark is applied at one end. A shock wave forms and accelerates along the tube, leaving nothing behind. Thus if you observed the shock wave at one time, t, and a later time t+x, you would see the shock wave gained both mass and velocity in the interval, with nothing to balance the momentum change. Failure to conserve momentum violates one the fundamental laws of physics.

To solve the problem, go back to first principles. The shock wave is not a single object, but a collection of objects, in particular molecules. Examine then a single pair of gas molecules in a chemical reaction. For simplicity, take the endothermic example of H2 and CO2. For this gedanken experiment isolate two samples of gas, on of H2, the other of CO2, and chill to just above the point where the gas will transition to a different phase. Now accelerate the contained of H2, fast enough to provide the energy required for the reaction, and aim it at the CO2, then consider an isolated collision of H2 and CO2.

H2+CO2+Energy => CO+H2O
For this analysis we will hypothesize that chemical processes take time; this is a defensible assumption as chemists and chemical engineers regularly chart the length of time different reactions take under different conditions. No reaction to date has been instantaneous.
During the time that the reaction occurs several things take place; one Oxygen atom breaks its bonds with the Carbon atom, the two Hydrogen atoms break the bond holding them together, the Oxygen atom forms bonds with both Hydrogen atoms, and the whole continues moving through space. Plus kinetic energy is converted to chemical potential energy. Oops, that cannot happen, the molecules are stuck together until the process is finished, but the kinetic energy has to be forced into the new bond arrangement, which would slow the mass and violate conservation of momentum. But it does happen. It happens all the time.
Since the molecules will both leave the reaction going in the same direction, the puzzle of how the vacuum forms is obvious; all the molecules in the shockwave begin their combustion going the same direction and minimization means they won’t change direction to go back the other way. Because virtually all of the molecules combust there is almost nothing left behind the shockwave.

Where is the momentum going at the molecular level? Good question; either the curvature of timespace allows the molecules to interact with the mass of the Earth to exchange momentum, a problem which might be solved with general relativity, or string theory has the solution in the manipulation of data which the mass of the molecules represents.

Your mission, should you choose to accept it Mr. Rocks, is to solve this problem with your vaunted superior science skills; to solve the problem and tell us which physics journal will showcase your solution.
 
Fellow, your knowledge of science is scant, and your understanding nil.
Ahhh yes, our local science doyen. You alone decides what is credible science and fits in the consensus.

The arrogance of the overpaid mill rat is cloying
 
Last edited:

Forum List

Back
Top