Yellowstone supervolcano 'even more colossal'

reason to believe that this is part of the equation = why we're not warming.:eusa_shhh:
The anthropogenic schemers are really upset. :lol: :lol:

Ya can't blame the sun's chill on the human race with its 28/10,000 impact on CO2 levels. :)

Less output of solar radiation into the climate system from a less active sun can explain the stall.

Lets imagine something for a second...

Sun 85% of what keeps us warm(We'd be close to absolute zero otherwise)
Green house = 15% of what keeps us a lot warmer ;)

However, since the Earth reflects about 30%[5][6] of the incoming sunlight, this idealized planet's effective temperature (the temperature of a blackbody that would emit the same amount of radiation) would be about −18 °C.[7][8] The surface temperature of this hypothetical planet is 33 °C below Earth's actual surface temperature of approximately 14 °C.[9]
https://en.wikipedia.org/wiki/Greenhouse_effect

Water vapor let's say is around 50% of that 15%. On the other hand it is very lived within the atmosphere and is driven by temperature. Co2 has it becomes a higher percentage warms the atmosphere evaporating more water vapor into the Atmosphere.


So lets say
Sun 85%
Green house forcing
10% water vapor(days to a week at most) = becomes even more of a forcing as the temperature moves up.
co2, methane, etc 5% as they stay in the atmosphere for decades.

Now lets Take that 85% and make it 82%.

So at one moment you can take the forcing on the climate system and go from
85%+the increasing variable of green house gases and you can decrease the most important piece of the climate system...Not only do you decrease energy going in but you also decrease the amount of energy reflected back towards the surface from the green house gas(slightly).

So yes it helps explain it.

85% + 15% = 100% of current energy into climate system
now is 82% + 15.5% = 97.5% of current energy

Of course this isn't exactly the numbers of the real life system but just to show on this would work.

Idiot.

The Sun can't possibly overcome the effects of modern CO2

Go read Scarfetta and West
 
Oldrocks,

How much geothermal energy does Yellowstone have?

Immaterial.

It's ground that is sacred to liberals and NO resource within the boundaries will ever be used for anything beyond their enjoyment.


Ya, because poking a hole to mine or exploit the active magma chamber isn't gonna cause the whole thing to erupt or anything. ...Oh wait...

What's the matter, you don't like geothermal energy?
 
It's hard to tell sometimes, PeanutBrain, whether you're insanely stupid or stupidly insane. The results (i.e., the crazy retarded drivel you spew) seem to be about the same either way in your case.

"PeanutBrain"

:eusa_eh:


Who would have expected teh internets to spawn such creative insults?
 

LOLOLOLOL......way to go, Don'tKnowShit.

An anonymous editorial in 'Investor's Business Daily' is so obviously the best source of accurate information about the Arctic sea ice, I'm amazed the rest of us didn't think of going there. LOLOLOL.

We all foolishly went to the National Snow and Ice Data Center and listened the all of those silly scientists who study the Arctic full time. What were we thinking? LOLOLOL?

On September 16th, 2012 sea ice extent dropped to 1.32 million square miles, it's minimum extent for the year and a new record low. That is about half the size of the average minimum extent from 1981 to 2010. The previous record low extent of 1.59 million square miles occurred on September 16th, 2007. Before that, the previous record low extent of 2.05 million square miles occurred on September 20th, 2005.

On September 13th, 2013 sea ice extent reached a minimum extent of 1.97 million square miles, slightly under the 2005 minimum extent.

Arctic Sea Ice News and Analysis
National Snow and Ice Data Center
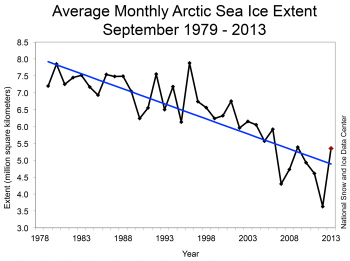
September average sea ice extent for 2013 was the sixth lowest in the satellite record. The 2012 September extent was 32% lower than this year’s extent, while the 1981 to 2010 average was 22% higher than this year’s extent. Through 2013, the September linear rate of decline is 13.7% per decade relative to the 1981 to 2010 average.

Figure3_Sept2013_trend-350x261.png

Monthly September ice extent for 1979 to 2013 shows a decline of 13.7% per decade. - Credit: National Snow and Ice Data Center

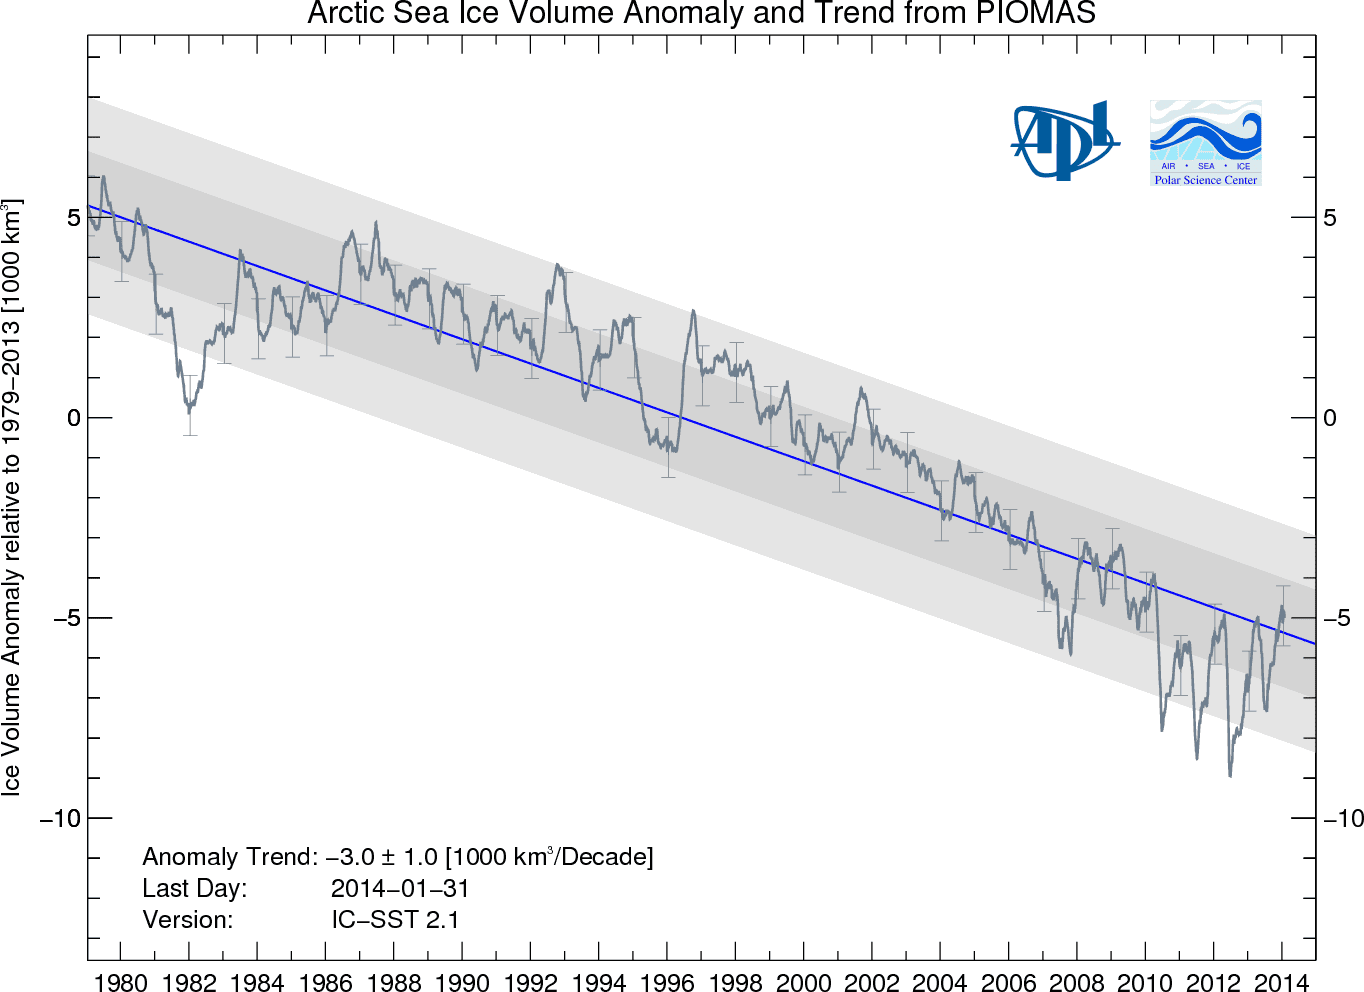
And then, of course, there is the sea ice volume.

BPIOMASIceVolumeAnomalyCurrentV2.png

Arctic sea ice volume anomaly from PIOMAS updated once a month. - Polar Science Center
 
Last edited:

Forum List

Back
Top