You've spent quite some time now claiming that the world is no longer getting any warmer. Now you seem to be claiming that it IS accumulating energy (you have made no attempt to deny the radiative imbalance that is getting worse as time goes by) but that it might not be due to CO2.
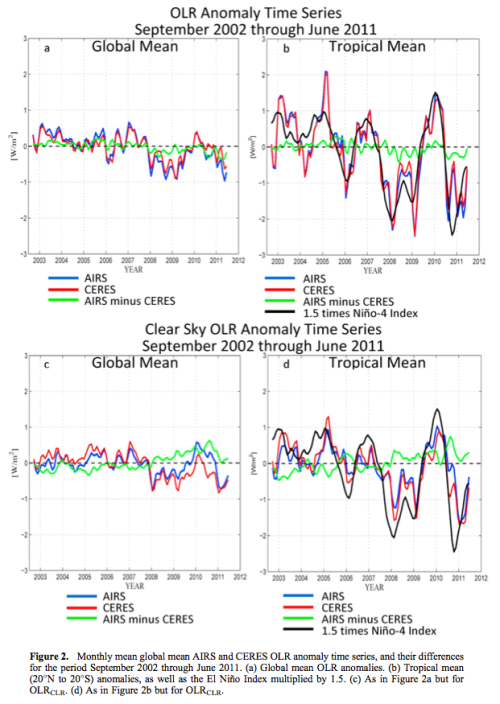
If the land and sea surface have been cooling from some reduction or cessation in greenhouse warming, and you don't want to accept that the energy has moved into the deep ocean, then there should be an INCREASE in OLR to space - but, of course, it's quite the opposite. That heat has to go someplace and YOU are the one running out of places to hide it.
There ARE equilibrium points. And the globe has recently gotten warmer. Implies that some forcing(s) has (have) changed.. NOT TODAY as the 2nd Grade AGW theory goes, but in RECENT history. Say the past 40 years..
I have always found it difficult to follow what you say; not from the level of your content but from the style in which you choose to explain yourself.
A thermal equilibrium could exist at virtually ANY point in the state space of the Earth but I highly doubt that the Earth has spent ANY significant amount of time in even approximate thermal equilibrium since the planet formed. The behavior of the system, like that of any large and complex system, is governed by non-equilbrium thermodynamics and heat transfer.
That we have been getting warmer for the last 150 years certainly suggests that forcings have changed. It's good to see some agreement. But then you say these forcing changes did not take place "...TODAY as the 2nd Grade AGW theory goes, but in RECENT history". First, the AGW theory was and is being developed by people much further along in their education and applicable experience than you and I. Your continuing fantasy that you're more intelligent or knowledgeable than the thousands of PhDs who've developed and studied and accepted that theory is actually embarrassing to deal with. Calling them "2nd Graders" does nothing but make you look foolish.
As you well know, AGW theory contends that greenhouse warming began increased with the increased GHG emissions of the Industrial Revolution. Data show that warming to have begun about 1880. That is what AGW says. So I have no reference to help me understand what you mean by "TODAY" or by "RECENT history" or even by "the past 40 years". Can you help us here? Why do you think AGW says forcing is changing TODAY and what do you think happened 40 years ago?
That forcing could be atmospheric, or solar, but it could ALSO BE a change in the thermal absorption paths on the surface and in the oceans.
No. Measurements of TSI show it to be inadequate to have caused the observed warming and what changes to the Earth's
surface could you even postulate that would have sufficient impact to have caused any discernible portion of the observed changes? And the world ocean's new circulational paradigm suspected to have caused the hiatus is already running out of capacity. After just 15 years of build up, the heated deep water is expected to create a very strong El Nino in the very near future. The idea that the Earth's oceans could store, much less hide, sufficient thermal energy to have caused the warming observed in the last century and a half is simply unsupportable. Warming from the greenhouse effect and its subsequent positive reinforcements, on the other hand, are perfectly adequate to be the cause of the observed warming.
You can measure OLR all you want, but only a small part of the OLR MATTERS to the CO2 theories of warming.. So that's an easy one.. If there are OLR changes OUTSIDE those absorption zones, you have to look elsewhere.
Sorry, wrong again. Two points: 1) Thermal energy absorbed by CO2 is not forever locked into CO2's emission bands. That energy can be transferred via radiation, conduction and convection to other materials with other emission bands. If the climate worked the way you (and others here) have attempted to treat it, the ONLY thing warmed by the greenhouse effect would be the greenhouse gases themselves. 2) The likeliest primary cause of the recent drop in OLR is not increasing CO2 absorption but the cooling of the ocean's surface as it's warm surface water gets swapped for cooler water from the depths. It is not the narrow peaks of CO2 absorption that you're likely to see in that OLR, but the exceedingly broad spectra of liquid water (see
Water absorption spectrum)
One possibility is that shifts in Solar Spectrum subtle enough to be hard to detect is modulating the GHouse window on the DOWN side. We KNOW that solar radiation has GREATLY increased in the UV bands over the past century. And we are just finding out this effect varies with Sun cycle.. We're actually pretty new to a LOT of this, because we haven't had the instrumentation of sufficient precision and real time access to see these effects..
From
NASA - SORCE's Solar Spectral Surprise
Measuring Variation
As recently as the 1970s, scientists assumed that the sun's irradiance was unchanging; the amount of energy it expels was even called the "solar constant." However, instruments similar to TIM and SIM have made clear that the sun's output actually fluctuates in sync with changes in the sun's magnetic field.
Indeed, TIM and its predecessor instruments, whose records of irradiance began in 1978, show that the sun's output varies by about 0.1 percent as the sun cycles through periods of high and low electromagnetic activity every eleven years or so. In practice, this cycling means the sun's brightness, as measured by TIM, goes up a bit when large numbers of sunspots and accompanying bright spots called faculae are present on the sun, yet goes down slightly when sunspots and faculae are sparse, like they have been in the last few years as the sun has gone through an unusually quiet period.
However, there is a critical difference between the SIM and TIM, explains Jerry Harder, the lead SIM instrument scientist and a researcher at the Laboratory for Atmospheric and Space Physics (LASP) at the University of Colorado in Boulder. While the TIM lumps all wavelengths -- including infrared, visible, and ultraviolet light -- into one overall measurement, the SIM isolates and monitors specific portions of the spectrum.
Notably, this makes SIM the first space-based instrument capable of continuously monitoring the visible and near-infrared portion, parts of the spectrum that are particularly important for the climate. SIM also offers the most comprehensive view of the individual components that make up the sun's total solar irradiance to date.
Some of the variations that SIM has measured in the last few years do not mesh with what most scientists expected. Climatologists have generally thought that the various part of the spectrum would vary in lockstep with changes in total solar irradiance.
However, SIM suggests that ultraviolet irradiance fell far more than expected between 2004 and 2007 -- by ten times as much as the total irradiance did -- while irradiance in certain visible and infrared wavelengths surprisingly increased, even as solar activity wound down overall.
The steep decrease in the ultraviolet, coupled with the increase in the visible and infrared, does even out to about the same total irradiance change as measured by the TIM during that period, according to the SIM measurements.
The stratosphere absorbs most of the shorter wavelengths of ultraviolet light, but some of the longest ultraviolet rays (UV-A), as well as much of the visible and infrared portions of the spectrum, directly heat Earth's lower atmosphere and can have a significant impact on the climate.
Climate Consequences?
Some climatologists, including Judith Lean of the United States Naval Research Laboratory, Washington, remain skeptical of the SORCE SIM measurements. "I strongly suspect the SIM trends are instrumental, not solar," said Lean, noting that instrumental drift has been present in every instrument that has tracked ultraviolet wavelengths to date.
"If these SIM measurements indicate real solar variations, then it would mean you could expect a warmer surface during periods of low solar activity, the opposite of what climate models currently assume," said Gavin Schmidt, a climate modeling specialist at NASA's Goddard Institute for Space Studies in New York City.
It would also imply that the sun's contribution to climate change over the last century or so might be even smaller than currently thought, suggesting that the human contribution to climate change may in turn be even larger than current estimates.
However, the surprising SIM measurements correspond with a period of unusually long and quiescent solar minimum that extended over 2007 to 2009. It may not be representative of past or future solar cycles, solar scientists caution.
Researchers will surely continue puzzling over the surprising SIM results for some time, but there is already considerable agreement on one point: that the need for continuous SIM and TIM measurements going forward has grown more urgent.
Modeling studies are showing that our climate depends critically on the true solar spectral variations. "If we don't have the instruments up there to watch this closely, we could be arguing about spectral irradiance and climate for decades," said Cahalan.
A new TIM instrument is slated to launch on the Glory satellite this February, but a replacement for the SORCE SIM instrument -- called the Total and Spectral Solar Irradiance Sensor (TSIS) -- likely won't fly until 2014 or 2015. This could create a gap between the current SIM and its replacement, a situation that would present a significant obstacle to identifying any possible longer-term trend in solar spectral irradiances, and thus to nailing down the sun's role in long-term climate change.
"Both instruments -- TIM and SIM -- are absolutely critical for understanding how climate works. We neglect either of them at our peril," said Cahalan.
**************************************************************************************
So, measuring the apparently dynamic solar spectra is very important, but our measurements to date do
not support the hypothesis that the warming we've observed could be due to spectral changes; in fact, it says quite the opposite.