Just cleaned up the back yard some more....hefted stuff outta the shed to put my lounge chair pads in...pruned some shrubs..made a few ditches to lead out into the field behind me...in general...prepping for the storms that MIGHT hit us sometime in October. Will give us much needed water but not nearly enough. Still, some is better than none.
That's not a model Mr Inept.. Do you not see the TOPEX and Jason labels? Do you not know what TOPEX and Jason are? Here's the original caption:
Side by side comparison of Pacific Ocean sea surface height (SSH) anomalies in 2015 (right) and during the famous 1997 El Niño (left). These 1997 and 2015 El Niño images were made from data collected by the TOPEX/Poseidon (1997) and the OSTM/Jason-2 (2015) satellites.
NASA
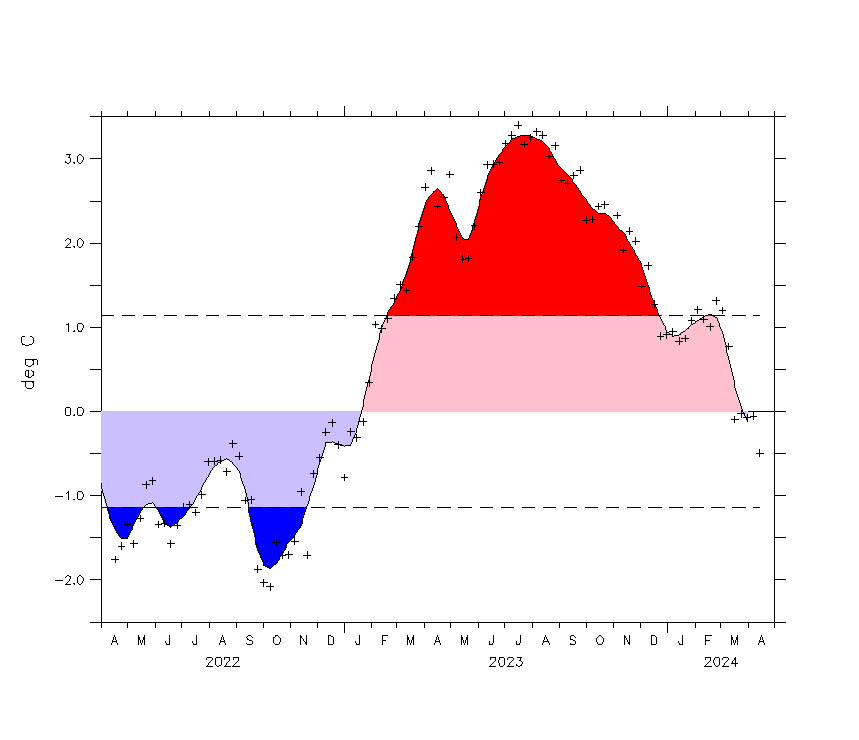
Kind of figured we see a jump but I did not expect this much of one. Taking this one right to the Top NOAA and GISS are. Going to have to check independent sources and see if the good old boys are doctoring data again.. SOSUS and other sources of buoy data do not reflect the temp increases these people are purporting. Even satellite data shows the level of warming is not present.
And they posted it one day early for some reason... Oh that's right, NOAA's urgent news to help Obama push his agenda this week.. Got to get a good start in the news cycle..
And they posted it one day early for some reason... Oh that's right, NOAA's urgent news to help Obama push his agenda this week.. Got to get a good start in the news cycle..
Poor little Billy Bob of the red ass. The present El Nino just keeps doing what the scientists said it was likely to do. And nobody at all pays attention to an internet imposter that claims to know more than the scientists. One that has demonstrated a complete lack of knowledge of science.
How about some real facts and not a bunch of contrived BS from alarmists...
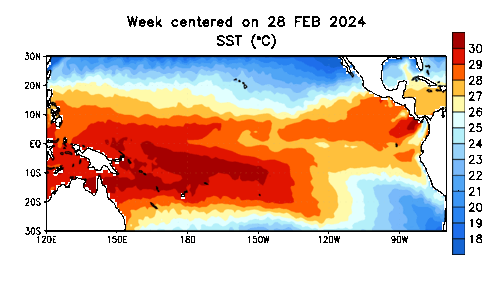
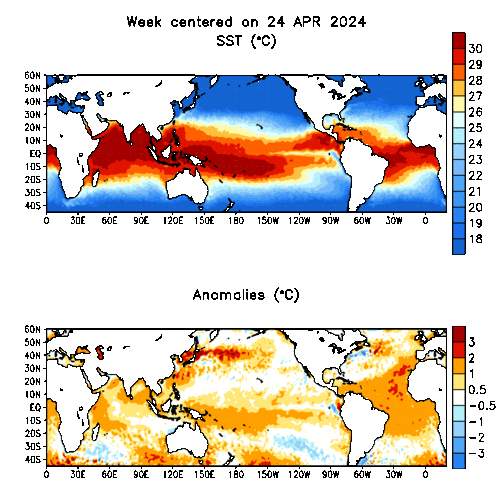
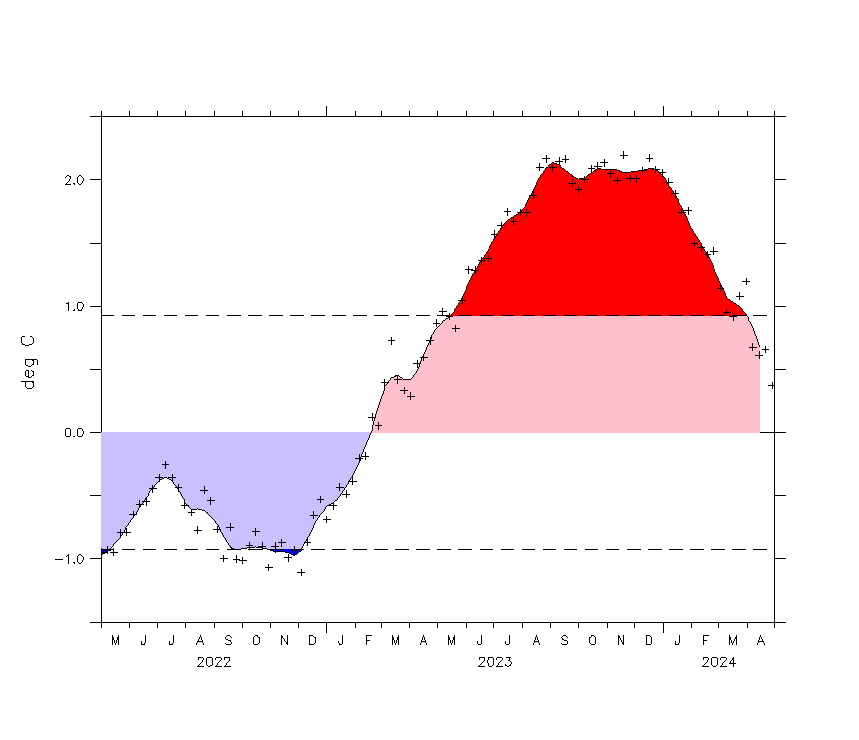
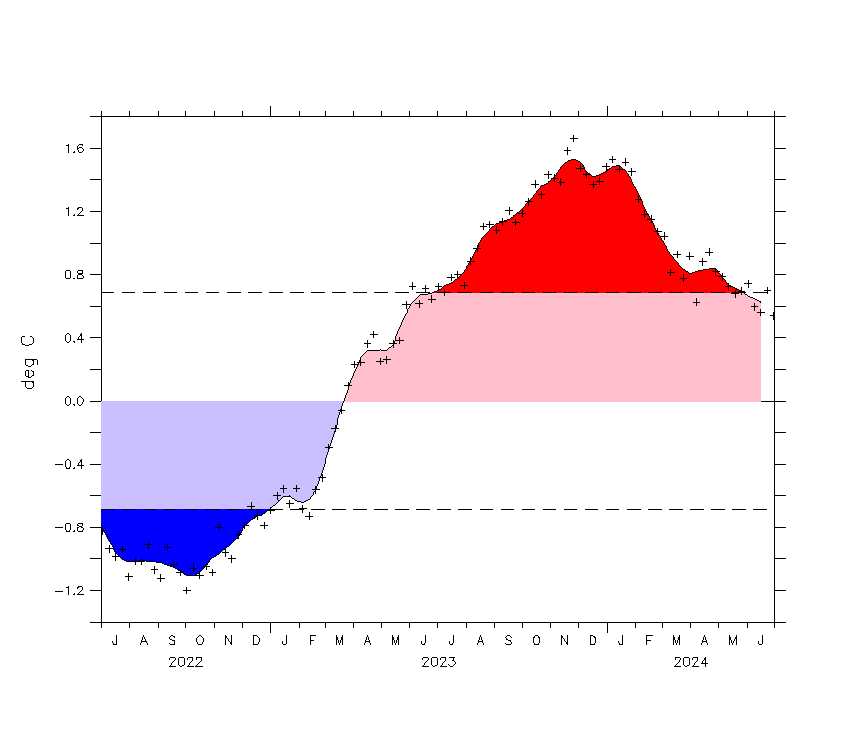
The daily loop of temps tells us a very different story from the one being spun by NOAA and GISS.
First off region one is cooling rapidly..
Secondly, Region three has peaked.. and is now cooling as the plus indicators showing 3 day averages shows.
Region Four has now peaked as well.. and is rapidly cooling..
The 3/4 average is doing exactly the opposite of the two regions it is supposed to average. This is why I dont believe the crap NOAA is spewing. The empirical evidence says a continued rise should not be happening.
LOL. And how many times have you posted crap like this, and then, within two weeks, it looked just as ridiculous as this will two weeks from now. What the hell were you bleating about a couple of months ago? El Mulko, or some such thing? Where did that go, dear little Billy Bob?