These people really hate our science institutions and think the scientist that work hard everyday are a bunch of liars. It makes me so ******* angry to see such disrespect from a bunch of trash.
Global Warming : Feature Articles
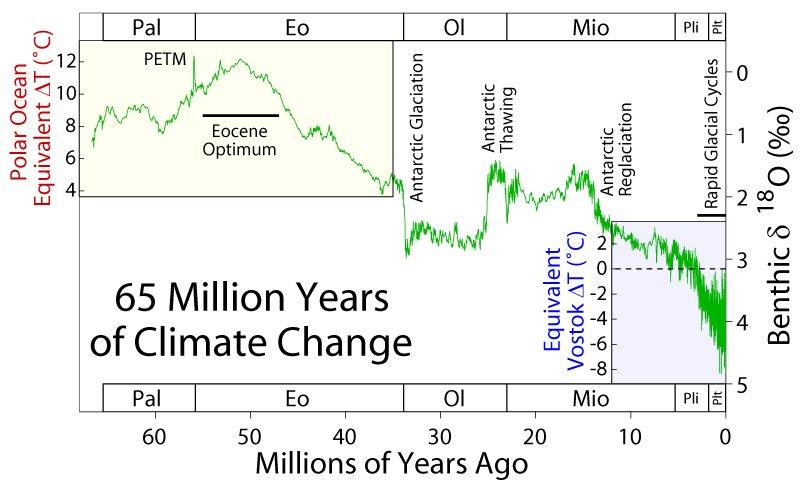
We hear a lot about how temperatures have begun to spike over the last 200 years, and they have too. In fact if one were to only look at the temperature data (from NASA) of the last 2000 years, they would naturally conclude that something was wrong. Here we see a declining temperature for 1800 years and then an abrupt uptick approximately 200 years ago. Pretty alarming, right?

Not really. It is all part of a natural cycle that has been occurring for the past 3 million years. This is the temperature data for the last 800,000 years (also from NASA). The peaks are the interglacial cycles and the troughs are the glacial cycles. From this data we can see two very important things. 1. that our current temperature is still 2C below the peaks of three of the last four interglacial temperature peaks and 2. that the temperature data for the past 2,000 years - where there is a declining temperature following by a sharp reversal - is seen in every interglacial cycle. It has the shape of a saw tooth. So our current temperature is within the normal range of an interglacial cycle, and the spike of the last 200 years which was preceded by an 1800 year decline is a normal saw tooth behavior that is seen in every interglacial cycle.

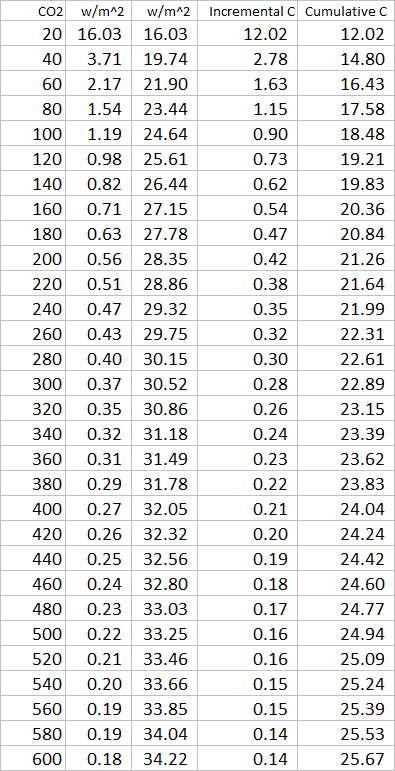
Is there a greenhouse gas effect from CO2? Sure. It is a good thing too because if there weren't the earth would be about 32F cooler than it is now. The relationship between CO2 concentration and associated temperature is logarithmic. Which means that increased concentrations have a progressively smaller warming effect. So a 120 ppm increase from 0 to 120 would have a much bigger impact (19.21 C) than a 120 ppm increase from 280 to 400 ppm (1.43 C).


There are other greenhouse gases besides CO2. Water vapor is the most dominant greenhouse gas in our atmosphere. The plot below shows the wavelength of each gas and the frequency of incoming solar radiation and outgoing thermal radiation. The total frequency curve is the sum of the frequencies for the greenhouse gases in our atmosphere. You can see that water vapor most closely matches the total frequency curve . The greenhouse gas effect for the same frequency is not additive. So it is only where holes exist in the frequency spectrum that CO2 can absorb the outgoing thermal radiation. Even though water vapor is the most dominate greenhouse gas, the absorbed energy returns to earth in the form of precipitation and it is not as long lived as CO2 or the other greenhouse gases. With this said, it was believed that water vapor in the upper troposphere would act as a positive feedback and accelerate warming from CO2.

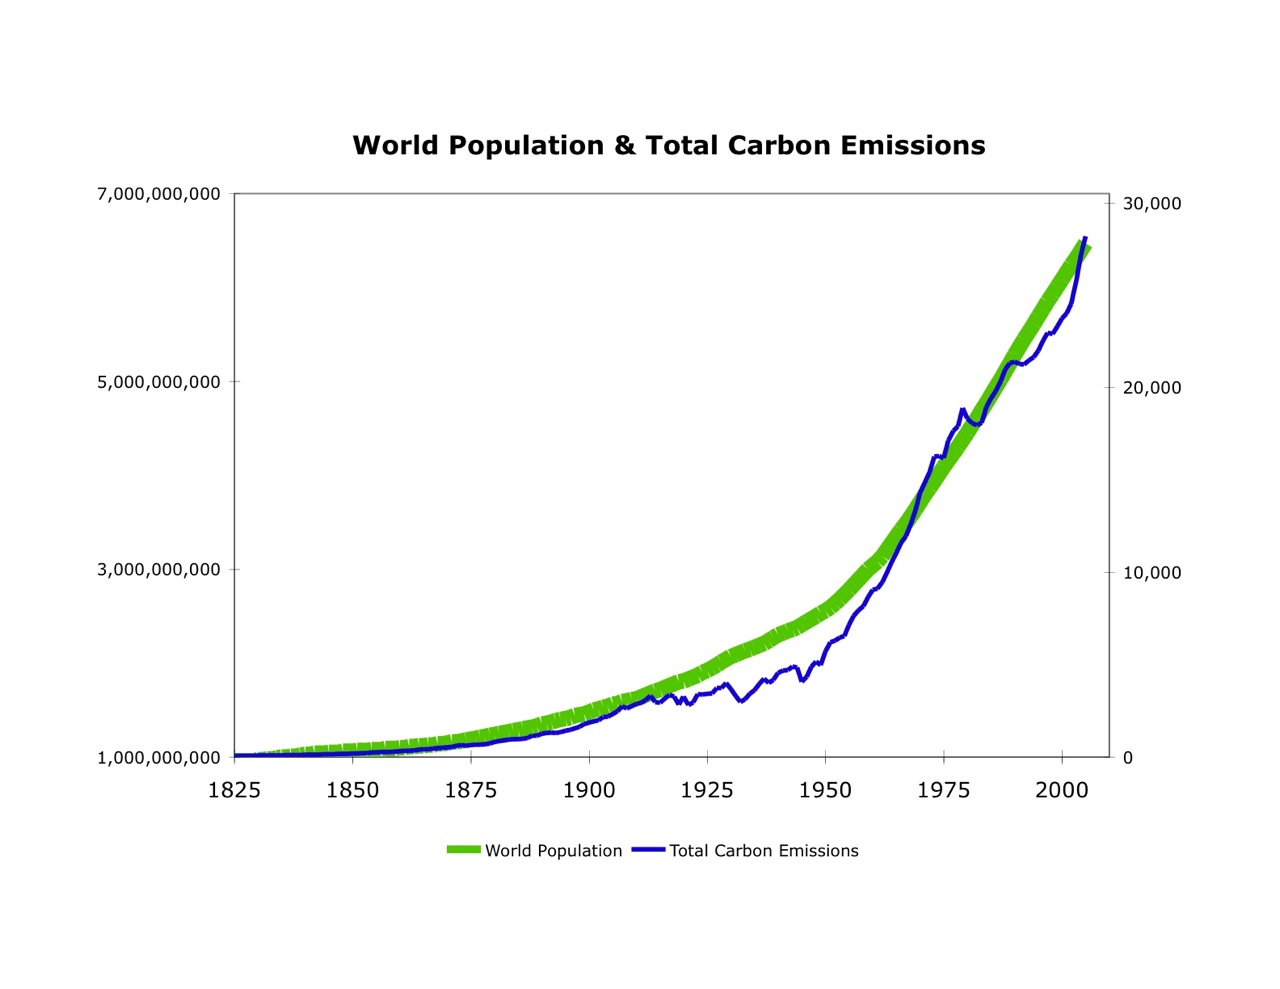
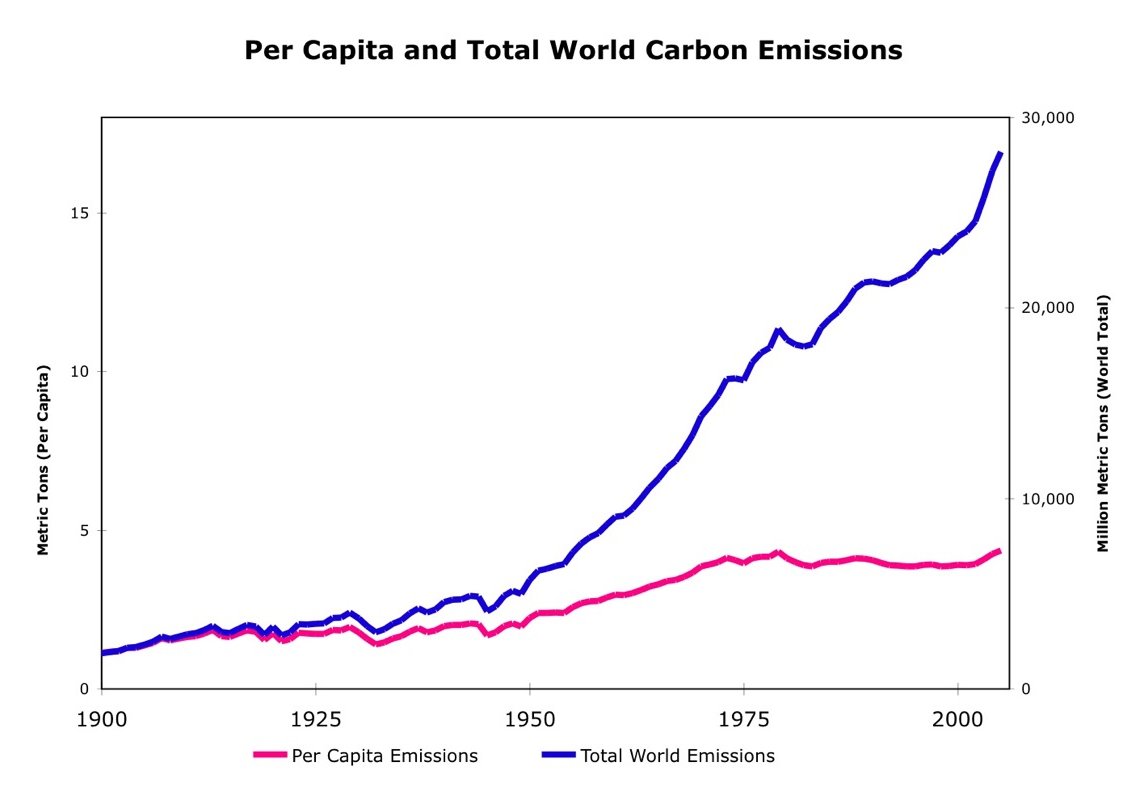
So if there is a greenhouse gas effect and atmospheric CO2 is rising, why shouldn't we be concerned about rising temperatures? Because the effect from the radiative forcing of CO2 is not immediate. The heat capacity of the oceans is huge. It takes a very long time for that effect to be felt because it takes a very long time to heat up the ocean. Which is one of the reasons how we know that the increased CO2 levels of the last 200 years are not responsible for the rising temperatures we see today . There hasn't been enough time. At least not without out feedback which we will discuss next. Historically CO2 has lagged temperature by 800 years and served to reinforce climate change, not drive climate change. As the earth cooled, the colder waters of the oceans would absorb more CO2. This reinforcing the cooling. As the earth warmed up the warmer waters of the ocean would release more CO2. Thus reinforcing the warming of the planet. In fact, 94% of all CO2 is stored in the ocean.
So how can so many scientists believe there is a problem? There are several reasons. One problem is that their projections for future CO2 emissions are unrealistic. Their only realistic projections are B1 and B2. The "B" stands for base which is based on the existing trend of CO2 emissions for the last 15 years. CO2 emissions have been increasing at 1 billion tons of CO2 per year for the past 15 years. Many people have latched on to the "A" curves which are based on accelerated CO2 emissions in excess of the 1 billion ton per year increases of the past 15 years. Given the world's economic situation, this is not likely. But many lay people in society have latched on to the most unrealistic cases as gospel.

The primary problem is that of groupthink. Where they are so certain that they are right that they do not consider any other possibility. Their models have unrealistic expectations for feedback from water vapor. Water vapor is the most dominant greenhouse gas in our atmosphere. It accounts for more radiative forcing than does CO2 but since it is not long lived it does not have an additive effect as the other greenhouse gases, but it is believed to play a critical role in our climate. However this role is not well understood.
The following is from Dr. Roy Spencer (former NASA scientist) who has identified one of the problems in their models.
New Satellite Upper Troposphere Product: Still No Tropical “Hotspot” « Roy Spencer, PhD
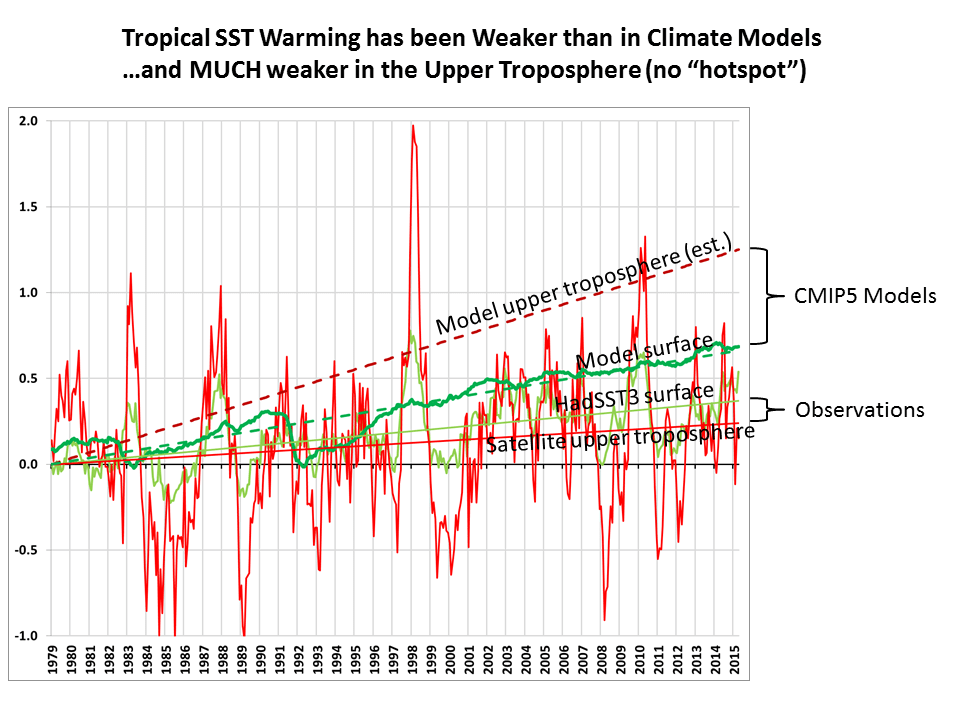
"One of the most vivid predictions of global warming theory is a “hotspot” in the tropical upper troposphere, where increased tropical convection responding to warming sea surface temperatures (SSTs) is supposed to cause enhanced warming in the upper troposphere.
The trouble is that radiosonde (weather ballons) and satellites have failed to show evidence of a hotspot forming in recent decades. Instead, upper tropospheric warming approximately the same as surface warming has been observed...."
"...Note that the linear warming trend in the UT product (+0.07 C/decade, bright red trend line) is less than the HadSST3 sea surface temperature trend (light green, +0.10 C/decade) for the same 20N-20S latitude band, whereas theory would suggest it should be about twice as large (+0.20 C/decade).
And what is really striking in the above plot is how strong the climate models’ average warming trend over the tropical oceans is in the upper troposphere (+0.35 C/decade, dark red), which I calculate to be about 1.89 times the models’ average surface trend (+0.19 C/decade, dark green). This ratio of 1.89 is based upon the UT weighting function applied to the model average temperature trend profile from the surface to 100 mb (16 km) altitude.
So, what we see is that the models are off by about a factor of 2 on surface warming, but maybe by a factor of 5 (!) for upper tropospheric warming.
This is all preliminary, of course, since we still must submit our Version 6 paper for publication. So, make of it what you will.
But I am increasingly convinced that the hotspot really has gone missing. And the reason why (I still believe) is most likely related to water vapor feedback and precipitation processes, which largely govern the total heat budget of the free-troposphere (the layer above the turbulently mixed boundary layer).
I believe the missing hotspot is indirect evidence that upper tropospheric water vapor is not increasing, and so upper tropospheric water vapor (
the most important layer for water vapor feedback) is not amplifying warming from increasing CO2. The fact that UT warming is indeed amplified — by about a factor of 2 — during El Nino events in the above plot might be related to the relatively short time scales involved, since convective heating and radiative cooling are far out of balance during short term variations, but are much closer to being balanced in the long-term with global warming.
The lack of positive water vapor feedback is an especially controversial assertion to make, given that (1) SSM/I satellite measurements of water vapor have
indeed been increasing in lock-step with SST warming, and (2) probably a unanimous opinion in the IPCC climate community that water vapor feedback is positive.
But the SSM/I measurements are largely insensitive to the very low levels of upper tropospheric water vapor, so they can’t tell us anything about upper tropospheric vapor. And while lower-tropospherc water vapor is governed mostly by SST, upper tropospheric vapor is governed by precipitation processes, and we don’t even understand how those might change with warming, let alone have those physics included in climate models.
Instead, I suspect the models have been adjusted so that precipitation systems detrain more water vapor into the upper troposphere with warming, simply because that’s what we see on short time scales, say during El Nino events, and so the convective parameterizations in the models are adjusted to meet that expectation..."
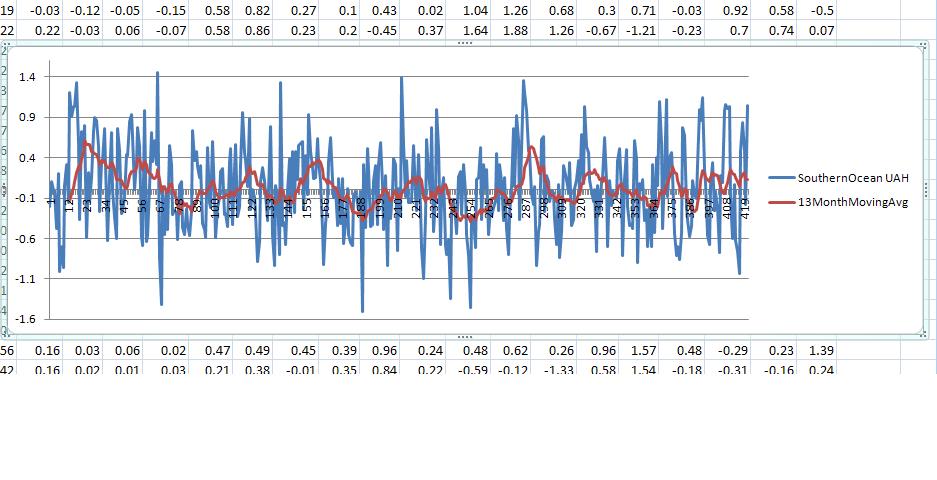
Additionally there has been no warming in the South Sea.
UAH satellite data of the southern ocean over (IIRC) a 30 year span
So factoring all of the data it is not surprising that their climate models continually underpredict their projections. In fact, just today has dialed back the rhetoric by stating,
"The ponderous response of the climate system also means that we don’t need to instantaneously reduce GHG amounts. However, despite uncertainties about some climate processes, we know enough to say that the time scale on which we must begin to reduce atmospheric GHG amounts is measured in decades, not centuries. Given the fact that the fastest time scale to replace energy systems is decades, that means that we must get the political processes moving now. And that won’t happen until the public has understanding of what is actually needed and demands it." James Hansen 12/2/16
SHOCK: The ‘Father of global warming’, James Hansen, dials back alarmLooks like the bullshit is back lol.