Sun Solar cycles is real, man made global warming is false.

I got about 40x. The IPCC says 45x. Okay

You are such a BullShit artist.. That chart is in W/m2.. Do you have an orbiting solar observatory that you're not telling us about? What you got is an act.. Your numbers are dimensionless. You are specious..

And the IPCC is a lying sack of shit.. Still waiting for a reference that says that TSI has only increased by 0.05W/m2 since 1750...

BTW Abraham --- I pondered the comment about what was used in the models being 2x or 4x.. I figured out was meant..

No one can fudge the TSI numbers from the satellite era.. They all have to agree (although ACRIM is still an unsolved outlier). So by stating that increase used in models in 2X or 4X the 1.2W/m2 since Maunder Minimum -- they are stating the uncertainty in the HISTORICAL values determined by proxy back in the 1700s.. Meaning that some studies have values for 1700 lower by those factors. NO ONE is re-interpretrating the common era measurements..

Your comment is meaningless. The magnitudes are still comparable as CO2 accounts for 80% of the variability and TSI for 2% of the variability. That means the CO2 compared to TSI has 80% divided by 2% or 40 times greater effect on the variability in global mean temperature from 1960 through 2013. The IPCC puts it at (2.29 W/m^2)/(0.05 W/m^2) or 45.8 times the effect. And, both of the ratios are dimensionless because they are simply ratios of to numbers with identical dimensions.

So, I get about 40x. The IPCC gets about 45x. That is the same order of magetudes and in perfect agreement given that I did a basic correlation while the IPCC does a more detailed model.

The fact is that you have absolutely nothing useful to add to the discussion which is why you eventually fall to calling people liars.

I completely understand that you are intellectually deficient and unable to distinguish between science and the mindless crap you spout. Calling you a liar would be generous. Rather, you are simply ignorant. You have absolutely no science to back up your bullshit.

Nice clown smoke.. Now go show us ONE REFERENCE that says the "Radiative Forcing of TSI relative to 1750" is just 0.05W/m2.... Garbage never morphs into rubies...

You have what we call call in the biz -- a bad case of Excelitis.. Where the tool exceeds the fool's ability to check the sanity of their assertions based on the crap they enter into Excel..

And Yes -- I am calling the IPCC and their "process" liars.. What of it??
 
Last edited:
You are such a BullShit artist.. That chart is in W/m2.. Do you have an orbiting solar observatory that you're not telling us about? What you got is an act.. Your numbers are dimensionless. You are specious..

And the IPCC is a lying sack of shit.. Still waiting for a reference that says that TSI has only increased by 0.05W/m2 since 1750...

BTW Abraham --- I pondered the comment about what was used in the models being 2x or 4x.. I figured out was meant..

No one can fudge the TSI numbers from the satellite era.. They all have to agree (although ACRIM is still an unsolved outlier). So by stating that increase used in models in 2X or 4X the 1.2W/m2 since Maunder Minimum -- they are stating the uncertainty in the HISTORICAL values determined by proxy back in the 1700s.. Meaning that some studies have values for 1700 lower by those factors. NO ONE is re-interpretrating the common era measurements..

Your comment is meaningless. The magnitudes are still comparable as CO2 accounts for 80% of the variability and TSI for 2% of the variability. That means the CO2 compared to TSI has 80% divided by 2% or 40 times greater effect on the variability in global mean temperature from 1960 through 2013. The IPCC puts it at (2.29 W/m^2)/(0.05 W/m^2) or 45.8 times the effect. And, both of the ratios are dimensionless because they are simply ratios of to numbers with identical dimensions.

So, I get about 40x. The IPCC gets about 45x. That is the same order of magetudes and in perfect agreement given that I did a basic correlation while the IPCC does a more detailed model.

The fact is that you have absolutely nothing useful to add to the discussion which is why you eventually fall to calling people liars.

I completely understand that you are intellectually deficient and unable to distinguish between science and the mindless crap you spout. Calling you a liar would be generous. Rather, you are simply ignorant. You have absolutely no science to back up your bullshit.

Nice clown smoke.. Now go show us ONE REFERENCE that says the "Radiative Forcing of TSI relative to 1750" is just 0.05W/m2.... Garbage never morphs into rubies...

You have what we call call in the biz -- a bad case of Excelitis.. Where the tool exceeds the fool's ability to check the sanity of their assertions based on the crap they enter into Excel..

And Yes -- I am calling the IPCC and their "process" liars.. What of it??

The more you deny the science of climate change, the stupider you get.

I don't need a reference, I can work it out from the raw data.

What do you have?

A lot less arrogance and self-esteem than THAT statement.

Your "analysis" is scoring close to 0.00 for the past decade and a half --- and the projections based on that theory are "off the rails". ((during the same time period using your BRAINDEAD CURVE FITTING -- TSI would have scored in the high 0.7 or 0.8 by curve fitting)) Big Bird says a flat line correlates BETTER with a flat line than the CO2 curve.

And if you HAVE that orbiting solar observatory and the TSI numbers from 1750, now would be the time to rescue the integrity of the IPCC..

WHERE THE FUCK did the 0.05W/m2 come from? It was higher in the LAST version IPCC chart (and they used the 1850s). Did the 1750s CHANGE since then? Did the patriots get warmer since then?
 
Last edited:
Nice clown smoke.. Now go show us ONE REFERENCE that says the "Radiative Forcing of TSI relative to 1750" is just 0.05W/m2.... Garbage never morphs into rubies...

You have what we call call in the biz -- a bad case of Excelitis.. Where the tool exceeds the fool's ability to check the sanity of their assertions based on the crap they enter into Excel..

And Yes -- I am calling the IPCC and their "process" liars.. What of it??

The more you deny the science of climate change, the stupider you get.

I don't need a reference, I can work it out from the raw data.

What do you have?

A lot less arrogance and self-esteem than THAT statement.

Your "analysis" is scoring close to 0.00 for the past decade and a half --- and the projections based on that theory are "off the rails". ((during the same time period using your BRAINDEAD CURVE FITTING -- TSI would have scored in the high 0.7 or 0.8 by curve fitting)) Big Bird says a flat line correlates BETTER with a flat line than the CO2 curve.

And if you HAVE that orbiting solar observatory and the TSI numbers from 1750, now would be the time to rescue the integrity of the IPCC..

WHERE THE FUCK did the 0.05W/m2 come from? It was higher in the LAST version IPCC chart (and they used the 1850s). Did the 1750s CHANGE since then? Did the patriots get warmer since then?

So you have nothing.

Curve fitting is what you want to do with that Fourier series. Mine is multivariate regression. Much different.
 
The quick and dirty equation is:

Solar Forcing Change = (1-albedo)*(TSI difference)/4

(1-albedo) is the percentage of sunlight absorbed by the earth.

The "4" divisor comes from the difference between disk area (pi*r^2) and sphere area (4*pi*r^2)

There are also some more factors concerning sunlight absorption in the upper atmosphere, but those are fairly small.

Anyways, plug those in with the TSI difference, and it comes out right.

Poor Flac, of course, did not consider albedo. Nor did he consider the fact that the earth is a sphere which is dark on one side, as opposed to being a disk with a sun on each side. That's why he got it so totally wrong.

It's what Flac always does. He screws up the problem setup, throws out a batch of numbers, gets a completely wrong answer, and then screams that everyone who got it right must be a fraud.
 
Last edited:
What is a good CO2 data set going back to 1850?? 1850 is the beginning of the recent history temp record. CDIAC provides this

TRENDS: Global and Hemispheric Temperature Anomalies

glnhsh.png


The same organization provides a CO2 data set

I have found this,
lawdome.gif


Which comes from the CDIAC. Historical CO2 Records from the Law Dome DE08, DE08-2, and DSS Ice Cores

It is, though, not on nice, consistent sample date increments. And it ends in 1978.

The smoothed set provided gives

lawdome.smooth75.gif


The CO2 data creates multiple issues. The first is the sporadic dates that requires interpolation, (smoothing in this case) which degrades the results of any analysis. The second is that of splicing the Mauna Loa data to fill in after 1978. The third being the smoothed set that itself creates some inaccuracies in the same manner that using interpolated data does.

I am thinking that it might be more accurate to just use the set with sporadic sample dates and dump any incomplete date sets. This can then be augmented with the more complete Mauna Loa set.

Any thoughts?
 
Last edited:
It was higher in the LAST version IPCC chart

Of course it was higher. The sun has cooled a bit since the previous report, hence the solar forcing factor is down.

(and they used the 1850s). Did the 1750s CHANGE since then? Did the patriots get warmer since then?

Nah, you're just babbling again. Here's where the previous figure is. Notice all the references to "1750". Who told you it was 1850? You ought to have a word with them.

Human and Natural Drivers of Climate Change - AR4 WGI Summary for Policymakers
 
Transcribed by hand.

8.4.1.2 TSI Variations since Preindustrial Time

The year 1750, which is used as the preinducstial refernce for estimating RF, corresponds to a maximum of the 11-year SC.[solar cycle] Trend analysis are usually performed over the minima of the solar cycles that are more stable. For such tend estimates, it is then better to use the closes SC minimum, which is in 1745. To avoid trends caused by comparing different portions of the solar cycle, we analyze TSI changes using multi-year running means. For the best estimate, we use a recent TSI reconstruction by Krivova et al (2010) between 1745 and 1973 and from 1974 to 2012 by Ball et al (2012). The reconstuction is based on physical modeling of the evolution of the solar surface magnetic flux, and its relationship with sunspot group number (before 1974) and sunspot umbra and penumbra and faculae afterwards. This provides a more detailed reconstructon than other models (see the time series in Supplementary Material Table 8.SM.3). The best estimate from our assessment of the most reliable TSI reconstruction gives a 7-year running mean RF between the minima of 1745 and 2008 or 0.05 Wm^-2. Our assessment of the range of RF from TSI changes is 0.0-0.10 Wm^-2 which covers several updated reconstructions using the same 7-year running mean past-to-present minima years (Wang et al, 2005; Steinhilber et al, 2009; Delaygue and Bard, 2011), see Supplementary Material Table 8.SM.4. All reconstructions rely on indirect proxies that inherently do not give consistent result. There are relaively large discrepancies among the models (see Figure 8.11). With these considerations, we adopt this value and range for AR5. This RF is almost half of that in AR4, in part because the AR4 esimtate was based on the previous solar cycle minimum while the AR5 estimate includes the drop of TSI in 2008 compared to the previous two SC minima (see 8.4.1). Concerningi the uncertainty range, in AR4, the upper limit corresponded to the reconstruction of Lean (2000), based on the reduced brightness of non-cycling Sun-like stars assumed typical of a Maunder Minimum (MM state. The use of such stellar analogues was based on the work of Bailunas and Jastrow (1990), but more recent surveys have not reproduced their results and suggest that the seclection of the original set was flawed (Hall and Lockwood, 2004; Wright, 2004); the lower limit from 1750 to present in AR4 was due to the assumed increase in the amplitude of the 11-year cycle only. Thus the RF and uncertainty range have beebn obrtained in a diferent way in AR5 compared to AR4. Maxima to maxima RF give a higher estimate than minima to minima RF, but the latter is ore relevant for changes in solar activity. Given the medium agreement and medium evidence, this RF value has a medium confidence level although confidence is higher for the last three decades). Figure 8.11 shows several TSI reconstructions modelled using sunspot group numbers (Wang et al, 2005; Krivova et al, 2010; Ball et al, 2012) and sunspot umbra and penumbra and faculae (Ball et al, 2012), or cosmogenic isotopes (Steinhilber et al, 2009; Delaygue and Bard, 2011). These reconstructions are standardized to PMOD solar cycle 23 (1996-2008) (see also Supplementary Material Section 8.SM.6).

For the MM-to-Present AR4 gives a TOA instantaneous RF range of 0.1-0.28 Wm^-2, equivalent to 0.08-0.22 Wm^-2 with the RF definition used here. The reconstructions in Schmidt et al (2011) indicate a MM-to-Present RF range of 0.08-0.18 Wm^-2, which is within the AR4 range although narrower. As discussed above, the estimates based on irradiance changes in Sun-like stars are not included in this range because the methodology has been shown to be flawed. A more detailed explanation of this is found in Suplementary Material Section 8.SM.6. For details about TSI reconstructions on millennia time scales, see Chapter 5, Section 5.2.1.1.
 
WHERE THE FUCK did the 0.05W/m2 come from? It was higher in the LAST version IPCC chart (and they used the 1850s). Did the 1750s CHANGE since then? Did the patriots get warmer since then?

This newer one took the latest solar cycle into account - AR4's did not. As you know, the sun is headed towards a minimum so this new cycle was lower in power and thus the growth since 1750 declined.
 
The quick and dirty equation is:

Solar Forcing Change = (1-albedo)*(TSI difference)/4

(1-albedo) is the percentage of sunlight absorbed by the earth.

The "4" divisor comes from the difference between disk area (pi*r^2) and sphere area (4*pi*r^2)

There are also some more factors concerning sunlight absorption in the upper atmosphere, but those are fairly small.

Anyways, plug those in with the TSI difference, and it comes out right.

Poor Flac, of course, did not consider albedo. Nor did he consider the fact that the earth is a sphere which is dark on one side, as opposed to being a disk with a sun on each side. That's why he got it so totally wrong.

It's what Flac always does. He screws up the problem setup, throws out a batch of numbers, gets a completely wrong answer, and then screams that everyone who got it right must be a fraud.

Yes there are factors that transfer TOA solar TSI changes to SURFACE forcings. That it is a SURFACE forcing is not stipulated in the IPCC chart. Even with these incorporated, the number in the chart should be approx

1.2W/m2 * .7 * .25 == .21W/m2

Which is FOUR TIME HIGHER than the IPCC estimate. And the brackets on this number should allow for HIGHER historical reported historical estimates. Perhaps .30W/m2.

You should note that in the original Trenberth famous (misnamed) "energy balance" cartoon, he explicitly shows the effect of albedo on the surface, BUT HIS DIAGRAM NEGLECTS THE factor of 4 division.. Since he uses 342 W/m2 as his solar source... You should ask HIM why he didn't apply the IPCC definition of "radiative forcing".
Kinda means that landmark diagram is seriously flawed --- doesn't it?

Another consideration is that the 20% absorbed by the atmos (Trenberth) is pumping up the back radiation volume CONSIDERABLY. Since it represents 65 W/m2 of heating potential that is STORED within the atmos and effective 24hrs a day.. ((Or 16W/m2 if you want to correct this Climate Wizard with this definition.))

My wager is that this atmospheric component of solar heating has a sufficient effect on the same "net cooling loss" that CO2 accomplishes. THe effect on surface temps of a hotter atmos -- reduces convection and conduction from the surface. (not quantified as a "forcing" in the simplistic IPCC analysis). As well as contributing to the "insolation" or back radiation amounts. NEEDS to be quantified..

You are wrong about the "2 suns" and the earth's rotation, since the earth has ALWAYS had a 24 hr day, a FORCING INCREASE does not depend on the duty cycle of the furnace (or any time element). Only ENERGY calculations bring that into play.

Thanks for the correction --- there is STILL massive lying and obvious attempts to minimize other climate factors..

Fact is --- we are not SEEING a temperature effect that REFLECTS a 1.8W/m2 from CO2 either. So on the other side of the lie --- they've overstated the "estimate" for the CO2 forcing..
 
Last edited:
WHERE THE FUCK did the 0.05W/m2 come from? It was higher in the LAST version IPCC chart (and they used the 1850s). Did the 1750s CHANGE since then? Did the patriots get warmer since then?

This newer one took the latest solar cycle into account - AR4's did not. As you know, the sun is headed towards a minimum so this new cycle was lower in power and thus the growth since 1750 declined.

Nope.. I like Mamooth's excuse better.. One solar cycle will not change TSI hardly at all.
Unless they are unscrupulous and are literally taking a difference between the values of today and 1750 without removing the 22 yr perturbations..
 
WHERE THE F--K did the 0.05W/m2 come from? It was higher in the LAST version IPCC chart (and they used the 1850s). Did the 1750s CHANGE since then? Did the patriots get warmer since then?

This newer one took the latest solar cycle into account - AR4's did not. As you know, the sun is headed towards a minimum so this new cycle was lower in power and thus the growth since 1750 declined.

Nope.. I like Mamooth's excuse better.. One solar cycle will not change TSI hardly at all.
Unless they are unscrupulous and are literally taking a difference between the values of today and 1750 without removing the 22 yr perturbations..

No? That came from their explanation. And they were only moving it by 0.05 W^-2: not a huge absolute drop. The drop in TSI is quite apparent in recent data. What do YOU hold the magnitude of the drop over the last two cycles to be?

Just out of curiosity, are you planning (or have you already) had a look at the AR5's explanation of how they came up with their TSI values?
 
Last edited:
What is a good CO2 data set going back to 1850?? 1850 is the beginning of the recent history temp record. CDIAC provides this

TRENDS: Global and Hemispheric Temperature Anomalies

glnhsh.png


The same organization provides a CO2 data set

I have found this,
lawdome.gif


Which comes from the CDIAC. Historical CO2 Records from the Law Dome DE08, DE08-2, and DSS Ice Cores

It is, though, not on nice, consistent sample date increments. And it ends in 1978.

The smoothed set provided gives

lawdome.smooth75.gif


The CO2 data creates multiple issues. The first is the sporadic dates that requires interpolation, (smoothing in this case) which degrades the results of any analysis. The second is that of splicing the Mauna Loa data to fill in after 1978. The third being the smoothed set that itself creates some inaccuracies in the same manner that using interpolated data does.

I am thinking that it might be more accurate to just use the set with sporadic sample dates and dump any incomplete date sets. This can then be augmented with the more complete Mauna Loa set.

Any thoughts?

I and my calibrated Mk 1 Eyeball would say a full linear interpolation of that Law Dome data wouldn't introduce a fraction of a percent of error in any parameter.
 
Even with these incorporated, the number in the chart should be approx

1.2W/m2 * .7 * .25 == .21W/m2

LISIRD - Historical Total Solar Irradiance

1750 -- 1360.76 W/m^2
2010 -- 1361.08 W/m^2

TSI diff, +0.32W/m^2. I'm not sure where you get +1.2. But there's your supposed factor-of-4 error, the error being on your input value.

Kinda means that landmark diagram is seriously flawed --- doesn't it?

We're not talking about your confusion concerning Trenberth's diagram. We're talking about your confusion with the AR5 chart. Those are separate issues.

Thanks for the correction --- there is STILL massive lying and obvious attempts to minimize other climate factors.

To the TrueBeliever, no facts or data will ever convince them that there isn't a VastGlobalSocialistConspiracy.

So much here to discuss, why do you waste sooo much time with the personal insults and attacks? You must not have much real ammunition.. You have to toss the box it came in.

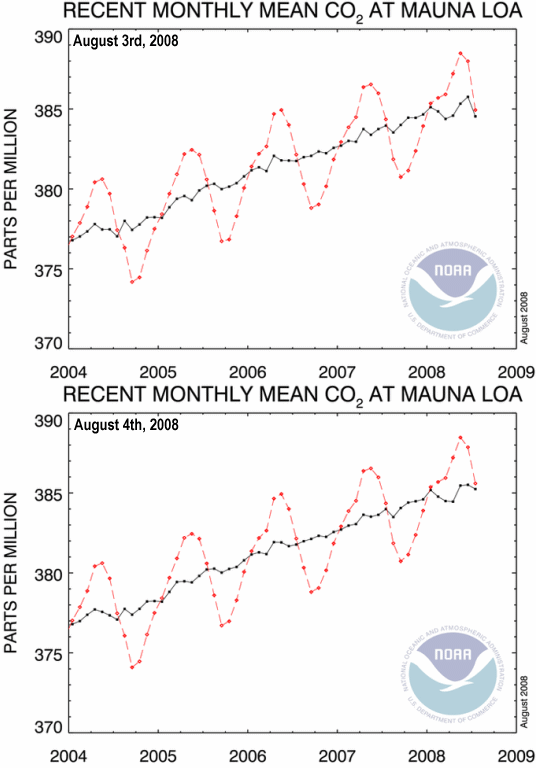
1) You do not use TSI from particular years.. WHY? Because they have a LARGE 11 yr cyclical pattern sitting on top of them. The amount of cyclical variation is enough to move that value back DECADES. Before you complain --- you should realize that the CO2 numbers are also buried in a one year cyclical pattern.

mauna_loa_0803-0804_blink.gif


You don't catch me bragging that the Feb value of Mauna Loa CO2 is at a 6 year low do you? NO-- because we're interested in the longer term average.. The same is so for TSI studies and the short term periodic functions are removed. There are 5 or 8 studies all confirm -- the LONG TERM trend for TSI is a 0.9 --> 1.4W/m2 change.. Gave you 2 sources.. Deal with it.

((For overachievers only --- The filtering of the sun cycles from the long term trend of TSI still preserves duty cycle variation of the high and low portions of a Sun Cycle. These are VALID FORCINGS in themselves since the RATIO time spent in high flux portion to low flux portion is as important as the magnitudes. ))

2) This APPROXIMATION of spreading the solar radiance over a sphere is not realistic. Pondered that last night. I can guarantee that the tropics at noon is recieving almost the full flux of the REAL distribution of TSI.. There is a PROJECTION that describes how this flux varies from equator to pole.. The divide by 4 in the approx simply EVENLY distributes the flux over the entire surface.. Weather and climate are not DRIVEN by ficticious averaging of that distribution.. But they are driven by the thermal differences resulting at different lattitudes.. So parts of the globe recieve the TOTAL TSI change.. It takes a computer and money to figure out the impllications, but the contribution is MUCH higher than that APPROXIMATION asserts..

3) CO2 is also not a uniform at the surface.. So this 1.8W/m2 is a CALCULATED figure (not measured) that is assumed to be a uniform forcing at all lattitudes. It's not.. At the poles, the total CO2 is less (thru an entire slice of the atmos), BUT the SURFACE FORCING is greater than it is in the tropics. This is because CO2 is NOT providing heat, it is DECREASING the loss rate to space. And that process of affecting the loss rate depends on the relative temp. profile of the vertical slice.. The lower the thermal gradients betwn surface and lower trop and upper trop, the less the insulating power of CO2 becomes.
This should be applied just like the correction for surface projection of TSI --- but apparently it's not generally in any IPCC preps.

4) Which brings me to the major point.. There are 3 other BIG reasons why the stated forcing for CO2 is THE OTHER PART OF THE LIE in that chart. And we haven't even really STARTED to discuss that aspect of the farce... It is HIGHLY overestimated and needs to be modified. (Meanwhile, discuss those TEMPERATURE driven natural cycles of CO2 at Mauna Loa) :lol:

My problem is NOT that one natural forcing explains everything. My "denial" is that CO2 is as powerful IN PRACTICE as the Sesame Street version of the story goes. And likewise, the OTHER forcings have been PURPOSELY minimized and hidden..

So there's really is TWO PARTS to this misrepresentation that the IPCC continues to present....
 
Last edited:
Why do you think "it my problem" that the major objection to this juvenile Climate Modeling is the use of silly averages that don't describe the problem..

As far as TSI goes, that power is integrated over time into heat ENERGY. And we know that the amount distributed to Rio in Brazil is 4 or 6 or whatever times GREATER than the silly ass number in the IPCC report? Or that Vladovostok is OVERSTATED in that estimated average by a factor of 2 or 4?

What kind of "climate model" would USE a number like that? And what kind of garbage would you expect from that in predicting surface temps???
 
Last edited:
1) You do not use TSI from particular years.. WHY?

Because it interferes with your conspiracy?

They were comparing 1750 with 2010. Hence, they compared 1750 with 2010. Quite the conspiracy.

the LONG TERM trend for TSI is a 0.9 --> 1.4W/m2 change.. Gave you 2 sources.. Deal with it.

More like 0.4, as can be eyeballed from the source I gave. Deal with it.

2) This APPROXIMATION of spreading the solar radiance over a sphere is not realistic.

And your evidence to back that up is ... you feel it must be so. If I feel the error must be in the opposite direction, does that cancel out your feeling?

So there's really is TWO PARTS to this misrepresentation that the IPCC continues to present....

Both parts being that you _feel_ there must be conspiracy to adjust the data. Understand that the scientists don't use your feelings-based method.

We need to get basic facts right or we're at an impasse.. I quoted Claus Frohlich in the following study --- and I gave you the SORCE/TIM reconstruction which is referenced nearly 100 times in the lit.. From the Frohlich paper...

ftp://pmodwrc.ch/pub/Claus/TSI_longterm/reconstr_TSI_grl_rev_submitted.pdf

For the first time a record of total solar irradiance covering 9300
years is presented, which covers almost the entire Holocene. This
reconstruction is based on a recently observationally derived relationship
between total solar irradiance and the open solar magnetic
field. Here we show that the open solar magnetic field can be
obtained from the cosmogenic radionuclide 10Be measured in ice
cores. Thus, 10Be allows to reconstruct total solar irradiance much
further back than the existing record of the sunspot number which
is usually used to reconstruct total solar irradiance. The resulting
increase in solarcycle averaged TSI from the Maunder Minimum
to the present amounts to (0.9±0.4)Wm−2. In combination with
climate models, our reconstruction offers the possibility to test the
claimed links between climate and TSI forcing.

WHO is Claus Frohlich????

FROHLICH, CLAUS - CIRS

Claus Fröhlich and his team at PMOD/WRC have been pioneers in research of solar radiation, its variations and impact upon the atmosphere and climate.

PMOD/WRC provides the world standard for global radiation, against which regional centers calibrate their instruments. As World Radiation Center PMOD is obliged to maintain and continuously improve absolute radiometers. Instruments developed at PMOD/WRC are among the most precise and stable ones. Besides developing and maintaining highly precise absolute radiometers,

In addition, Claus Fröhlich and his team have been pioneers in UV radiation research and monitoring, as well as research on infrared radiation. PMOD/WRC presently operates a network of 11 highly precise infrared radiometers working over a high profile between 370 m and 3580 m altitude, enabling to quantify the height dependance of the radiation budget, with the goal of quantitatively proving the variation of the Earth’s greenhouse effect.

Claus Fröhlich’s by far most important achievements are related to his space experiments. In 1988 already, he could prove for the first time, from his IPHIR experiment aboard PHOBOS, solar oscillations.

His experiment SOVA is, from the Swiss point of view, something special, as it operated aboard the satellite EURECA, which was released from the Space Shuttle Atlantis in 1992,by a Swiss astronaut, and safely returned one year later to the Kennedy Space Flight Center.

Claus Fröhlich’s most successful space experiment is VIRGO aboard SOHO, which has been measured, with very high precision, the Sun’s radiation since 1996.The instruments comprising VIRGO investigate the varying radiation flux towards Earth as well as solar oscillations enabling Helio-Seismology for understanding the Sun’s interior.

Only the leading godfather of orbiting solar observatories..

Abraham: Sorry pal.. But you don't illuminate a lie by quoting the liars.. I read PLENTY enough of IPCC crap to make that determination.. Best I can tell from their EXCUSES --- they are pulling the trick that Mamooth attempted. To take 2 points in isolation that REMOVE THE BASELINE CHANGES and based a phoney number on SOLELY sunspot cycles.

That's the lie they were using when I last read their excuses...

I spent good time discussing salient points of this issue.. It's NOT my feelings, it's what science says..

So Mamooth --- Sources, links, descriptions.. I've got several besides these two.. Please don't screw yourself and quote skepticalscience or the IPCC.. And hopefully -- your geniuses can match Claus Frohlich..
THEN MAYBE --- if the personal attacks HALT --- we can continue..

SECOND condition for continuing this discussion.. QUIT CUTTING OFF MY RESPONSES for leverage to your weak comebacks.
They explain the WHYS and the RATIONALE that you prove you don't understand. For instance, I EXPLAINED WHY we don't just take any two random RAW observations of TSI and call it a TREND.. Or did that CO2 graph from Mauna Loa not MEAN ANYTHING TO YA???
 
Last edited:
Regardless of any alternative model that might preferred, the model absolutely must explain and be consistent with the regression I presented. The fact of the matter is that TSI does not account for the variability.

And for all his whining about this, that, and the other thing, he has proposed no demonstrated model.

I said he wouldn't. I found the concept humorous. And for all his sense of "hurt", he never will present an actual model. I can guarantee it.
 
Last edited:

Forum List

Back
Top