Sunsettommy
Diamond Member
- Mar 19, 2018
- 16,349
- 14,081
- 2,400
- Thread starter
- #81
:^)[
It has NEVER even reached .20C in ANY decade.
You are easily mislead, which usually mean you lack critical thinking skills.
Instrumental temperature record - Wikipedia
`
The captioning text that goes with this ***** slapping graphic
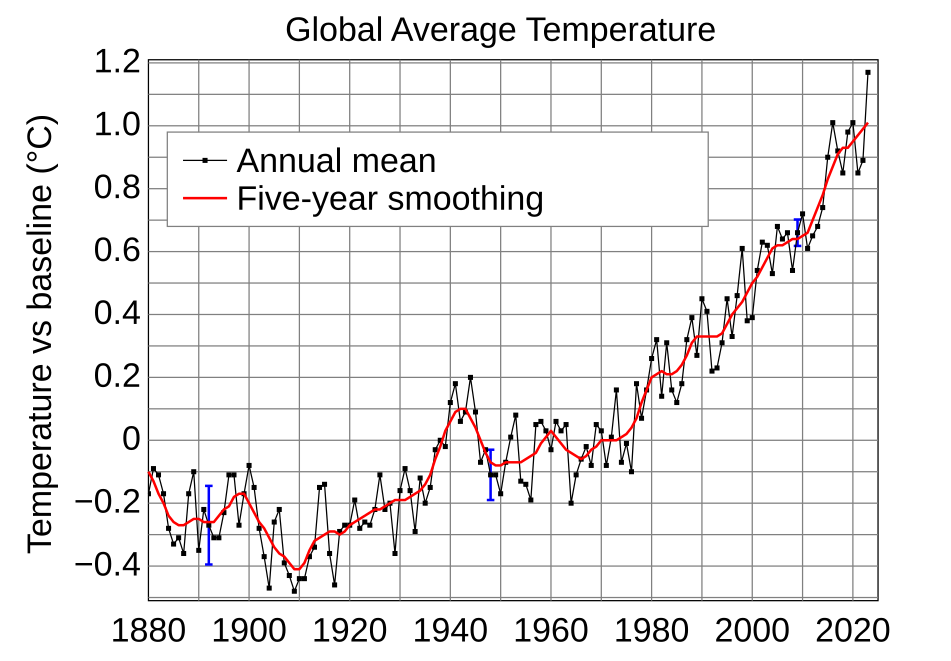
Global mean surface temperature change from 1880 to 2017, relative to the 1951–1980 mean. The black line is the global annual mean and the red line is the five-year lowess smooth. The blue uncertainty bars show a 95% confidence limit. Source: NASA GISS.
NASA Goddard Institute for Space Studies - Data.GISS: GISS Surface Temperature Analysis: Analysis Graphs and Plots
Land-ocean temperature index, 1880 to present, with base period 1951-1980. The solid black line is the global annual mean and the solid red line is the five-year lowess smooth, i.e. a nonparametric regression analysis that relies on a k-nearest-neighbor model. The function is evaluated using a fraction of data corresponding to a ten year window of data, giving an effective smoothing of approximately five years. The blue uncertainty bars (95% confidence limit) account only for incomplete spatial sampling. This is based upon Fig. 1A in Hansen et al. (2006) and Fig. 9a in Hansen et al. (2010). The graph shows an overall long-term warming trend.
GISS is a the WORST temperature data set. It has been changed so many times now that it is junk. The erasure of a well known COOLING trend from the 1940's to the 1970's is a dead give away.
Use Old Rocks favorite Satellite set instead.