0.2 to 0.6 uM? 8.3% That must be the cause of all that snow.
And, I find it interesting that as of last Sunday Same Shit was STILL looking for UV data to support the ozone contention he's been screaming about for the last four weeks as the absolute word of god. I posted four different UV datasets and NONE of them supported his contention. But, of course deniers ignore anything that refutes their presuppositions. ; - )
Actually skid mark...you posted 4 data sets with pretty colors which you, as usual, completely misunderstood. Lets have a look shall we?
The discussion revolved around the wild fluctuations in solar output of particular bands of UV.....not total output....and remember...it is about the particular wavelengths of UV that are responsible for the production of ozone in the stratosphere.
Here is what you posted...
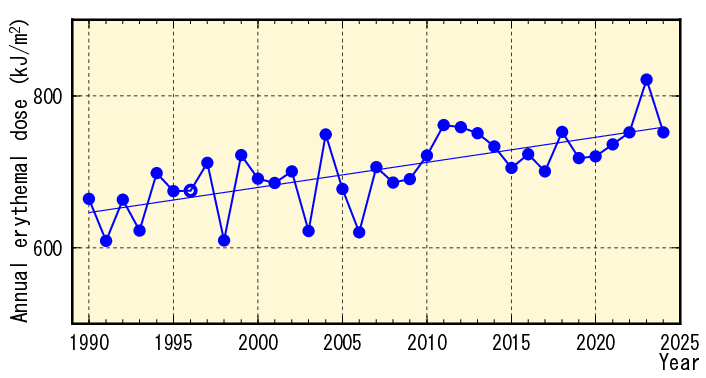
Can you point out any solar output in a particular wavelenght in this graph. Is there anything here that would suggest that solar output of UV in the wavelengths responsible for the production of UV in the stratosphere is, or is not responsible for changes in O3?
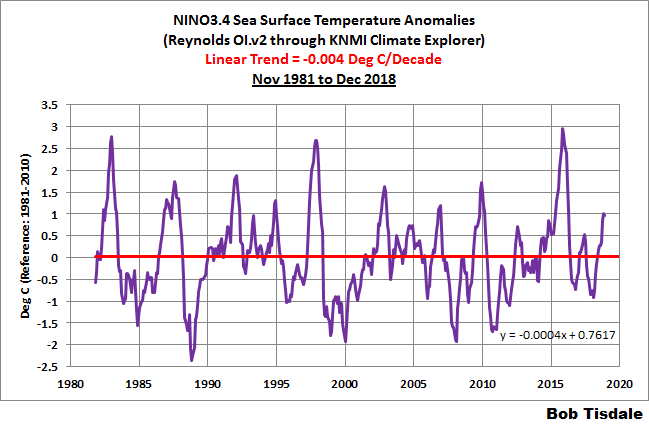
While this set of graphs do show a decreasing trend, once again can you point out any solar output in a particular wavelenght in this graph. Is there anything here that would suggest that solar output of UV in the wavelengths responsible for the production of UV in the stratosphere is, or is not responsible for changes in O3?
Once again can you point out any solar output in a particular wavelenght in this graph. Is there anything here that would suggest that solar output of UV in the wavelengths responsible for the production of UV in the stratosphere is, or is not responsible for changes in O3? Did you note that while it doesn't show any particular wavelength, it does show a decreasing trend in UVb from 2009 - 2015? Did that not register with you?
Is this what passes for science in your mind...a few graphs which in no way support your claims....is this sort of bullshit all it takes to fool you? Really? Are you this stupid? If so, it is little wonder that you are a complete dupe.
Do feel free to point out anything within your pretty little graphs that dispute a single suggestion from the information I posted...Here, let me post it again...
Researchers study fluctuations in solar radiation
clip: That is why Krivova's model SATIRE (Spectral And Total Irradiance Reconstruction) also takes the fluctuations in the UV light into account. "
Although the UV light makes up just 8 percent of the total solar irradiance," she says, "the fluctuations are considerable.
Solar Variability and Terrestrial Climate | Science Mission Directorate
Of particular importance is the sun's extreme ultraviolet (EUV) radiation, which peaks during the years around solar maximum. Within the relatively narrow band of EUV wavelengths, the sun’s output varies not by a minuscule 0.1%, but by whopping factors of 10 or more.
This can strongly affect the chemistry and thermal structure of the upper atmosphere.
Sun Cycles and Climate Change
Lean assumes that the change in UV output from the Sun must have been 6 times larger than that of visible light (
a fact which, if true, holds interesting implications for the history of the ozone layer)
https://pubs.usgs.gov/fs/fs-0095-00/fs-0095-00.pdf
However, bright regions surrounding the sunspots, called faculae, cause the sun to brighten at peak activity (Lean and Foukal, 1988). Lean and others (1995a) estimated that during the Maunder Minimum, total solar irradiance was reduced by 0.2 percent relative to a present quiet sun (minimum of the mid-1990’s),
but total ultraviolet (UV)
radiation was reduced by 1.04 percent. This is important because it is the UV radiation that modulates ozone production, which, in turn, affects the dynam- ics and energetics of the middle and upper atmosphere through radiative processes and dynamic mechanisms involving convective Hadley cell circu- lation (Haigh, 1996).