How much is sea level rising?
How much is sea level rising?
Link to this pageThe skeptic argument...
Sea level rise is exaggerated
"We are told sea level is rising and will soon swamp all of our cities. Everybody knows that the Pacific island of Tuvalu is sinking. Around 1990 it became obvious the local tide-gauge did not agree - there was no evidence of 'sinking.' So scientists at Flinders University, Adelaide, set up new, modern, tide-gauges in 12 Pacific islands. Recently, the whole project was abandoned as there was no sign of a change in sea level at any of the 12 islands for the past 16 years." (Vincent Gray).
What the science says...
Select a level... Basic Intermediate
A variety of different measurements find steadily rising sea levels over the past century.
Sea level rises as ice on land melts and as warming ocean waters expand. Sea level rise mutually corroborates other evidence of global warming as well as being a threat to coastal habitation and environments.
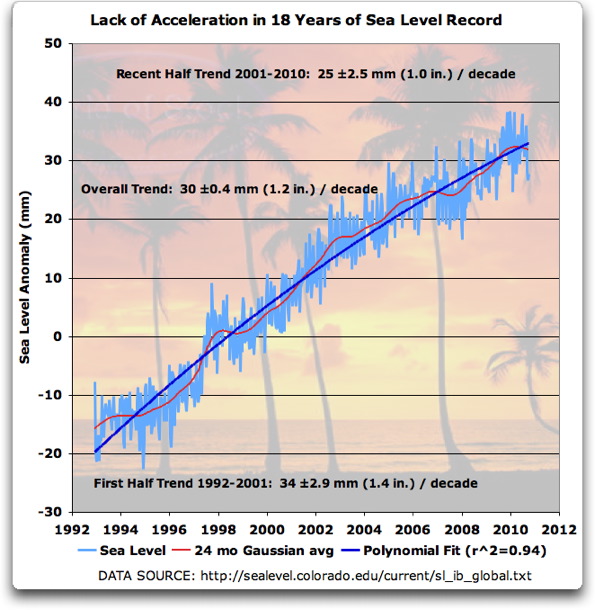
The blue line in the graph below clearly shows sea level as rising, while the upward curve suggests sea level is rising faster as time goes on. The upward curve agrees with global temperature trends and with the accelerating melting of ice in Greenland and other places.
Because the behavior of sea level is such an important diagnostic aid for tracking climate change, skeptics seize on the sea level record in an effort to cast doubt on this evidence. Sea level bounces up and down slightly from year to year so it's possible to cherry-pick data falsely suggesting the overall trend is flat, falling or linear. You can try this yourself. Starting with two closely spaced data points on the graph below, lay a straight-edge between them and notice how for a short period of time you may create almost any slope you prefer, simply by being selective about what data points you use. Now choose data points farther apart. Notice that as your selected data points cover more time, the more your mini-graph reflects the big picture.
The lesson? Always look at all the data, don't be fooled by selective presentations.