Navigation
Install the app
How to install the app on iOS
Follow along with the video below to see how to install our site as a web app on your home screen.
Note: This feature may not be available in some browsers.
More options
Style variation
You are using an out of date browser. It may not display this or other websites correctly.
You should upgrade or use an alternative browser.
You should upgrade or use an alternative browser.
Satellite data show Earth's glaciers in massive decline
- Thread starter Crick
- Start date
Your problem is that things seem to be just staying the same. No Ice Age, no Cooked Earth.
Your HolyIceAge never arrives, and the fast warming continues inexorably, but that doesn't diminish your religious zeal. As is the case with every doomsday cult, whenever your frozen doomsday fails to arrive, you just push the date back some more.
I notice that the Global Warming fanatics always choose something to point at that nobody normal can see, like icebergs, or glaciers, or polar bears, to pretend that the World Is Coming to An End unless we raise taxes and put in a whole lot of gross inconveniences --- they never say anything about changes everyone could easily SEE ---- because there aren't any.
What a pile of nothing.
I am doing cold hard calculations
I am doing cold hard calculations
Where?
Making unsupported claims is not "doing cold hard calculations".
Remember, you're talking to the reality-based community here. We require evidence, and you only supply emotion.
You are ******* idiot if you think an increase of 130 PARTS PER MILLION of CO2 is responsible for any of that.Major desertification in Texas. Flooding and shorter growing seasons (other types of climate change) in other areas. AGW ain't no panacea.. no actual box of chocolates for anyone.
You need to move away from thinking your emotional hunches have ANYTHING to do with valid science. They don't. And you need to brush up your numbers. Pre-industrial CO2 was 280 ppm. The current level is 420 ppm. 420-280 = 140, not 130. And then, perhaps you should think about like this: 140*100/280 = a 50% increase. Now doesn't that SOUND more dramatic? Good, Because it ******* IS.
dRF=5.35ln(420/280) = 2.1692 W/m^2
2.169238328 W/m^2 x 0.75 C deg / W/m^2 = 1.6269 C deg
So why didn't the temperature rise by 1.6269 C deg when CO2 rose from 280 ppm to 420 ppm?
Why did temperature only rise by 0.8 C deg?
And according to IPCC's belief that there should be a positive feedback the temperature should have actually risen by more than 1.6269 C deg, right?
So since the actual temperature was less than that predicted from radiative forcing alone, what does that tell you about feedback?
Could it be that there was possibly a negative feedback instead of a positive feedback?
Now is the time for Crick mamooth and Grumblenuts to provide an explanation, if they have one.
Toddsterpatriot
Diamond Member
You are ******* idiot if you think an increase of 130 PARTS PER MILLION of CO2 is responsible for any of that.Major desertification in Texas. Flooding and shorter growing seasons (other types of climate change) in other areas. AGW ain't no panacea.. no actual box of chocolates for anyone.
You need to move away from thinking your emotional hunches have ANYTHING to do with valid science. They don't. And you need to brush up your numbers. Pre-industrial CO2 was 280 ppm. The current level is 420 ppm. 420-280 = 140, not 130. And then, perhaps you should think about like this: 140*100/280 = a 50% increase. Now doesn't that SOUND more dramatic? Good, Because it ******* IS.
I don't recall your explanation of how "Mike's Nature Trick" made the data more accurate.
If you get a chance, please do so.
It'd be much appreciated.
- Thread starter
- #208
This graph includes temperature data from where YOU live as well as where ALL the "NORMAL" people live. This is NOT "just staying the same"Your problem is that things seem to be just staying the same. No Ice Age, no Cooked Earth.
Your HolyIceAge never arrives, and the fast warming continues inexorably, but that doesn't diminish your religious zeal. As is the case with every doomsday cult, whenever your frozen doomsday fails to arrive, you just push the date back some more.
I notice that the Global Warming fanatics always choose something to point at that nobody normal can see, like icebergs, or glaciers, or polar bears, to pretend that the World Is Coming to An End unless we raise taxes and put in a whole lot of gross inconveniences --- they never say anything about changes everyone could easily SEE ---- because there aren't any.
What a pile of nothing.
Try using microdegrees instead of tenths --- I bet you could get a great hockeystick graph going straight up. It wouldn't mean anything, just like this one, but you global warming types don't care, as long as you can propagandize.This graph includes temperature data from where YOU live as well as where ALL the "NORMAL" people live. This is NOT "just staying the same"Your problem is that things seem to be just staying the same. No Ice Age, no Cooked Earth.
Your HolyIceAge never arrives, and the fast warming continues inexorably, but that doesn't diminish your religious zeal. As is the case with every doomsday cult, whenever your frozen doomsday fails to arrive, you just push the date back some more.
I notice that the Global Warming fanatics always choose something to point at that nobody normal can see, like icebergs, or glaciers, or polar bears, to pretend that the World Is Coming to An End unless we raise taxes and put in a whole lot of gross inconveniences --- they never say anything about changes everyone could easily SEE ---- because there aren't any.
What a pile of nothing.
View attachment 490248
Yeah, they are always talking about HUGE WARMING of areas of the Earth no one can get to, no one can see --- in addition to glaciers, icebergs, polar bears, they have cornered the market on Antarctica ice shelves falling off. Big as Rhode Island! Big as Manhattan!! Nothing ever comes of it, and ice has been falling off both polar areas since the world was young, but maybe you can worry someone, if they aren't too smart.
Grumblenuts
Gold Member
- Oct 16, 2017
- 16,066
- 5,544
- 210
Okay, time to watch the dingbat eat crow again..1.6269 C deg

Hint, hint:
A positive anomaly indicates the observed temperature was warmer than the baseline, while a negative anomaly indicates the observed temperature was cooler than the baseline.
Last edited:
Why would I need to eat crow. You got it a little closer but you are still 0.4 C below the predicted associated temperature and that's without the so called positive feedback. So where is the missing 0.4 C.
That's a 25% error WITHOUT positive feedbacks. How much of an additional temperature increase was there supposed to be because of positive feedbacks? Cause we would need to add that error into it to, right?
Of course... if you were wondering what they call the zero temperature reference, it kind of destroys your argument cause the actual gain is less than 1C. You cherry pickers crack me up.
Okay, time to watch the dingbat eat crow again..1.6269 C deg
Hint, hint:
A positive anomaly indicates the observed temperature was warmer than the baseline, while a negative anomaly indicates the observed temperature was cooler than the baseline.
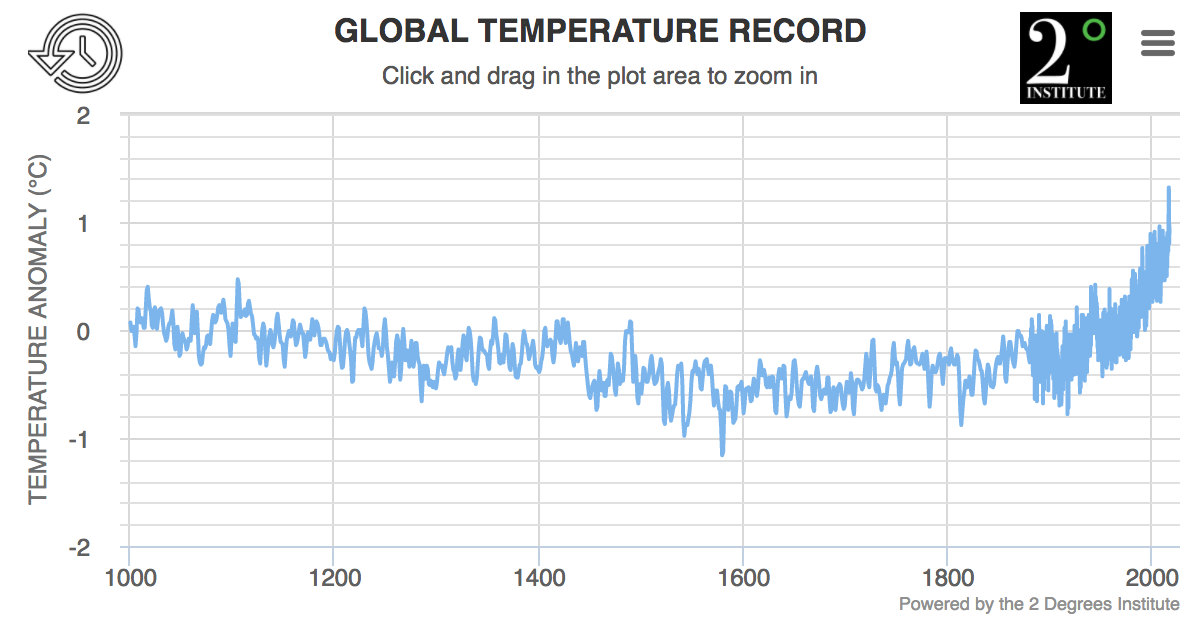
Current & Historical Global Temperature Graph
See how global temperatures are climbing with this fully interactive graph of the past 800,000 years. A project by the 2 Degrees Institute.
Grumblenuts
Gold Member
- Oct 16, 2017
- 16,066
- 5,544
- 210
Oop, climate scientist poser still off the rails.. try actual Climate Change for a change, son!
Stay tuned for likely more episodes of "As The Dingbat Squirms" or "Watch Shameless Deniers Deny The Bleeding Obvious"

Stay tuned for likely more episodes of "As The Dingbat Squirms" or "Watch Shameless Deniers Deny The Bleeding Obvious"
So you want to use an 1880 reference and pick the lowest temperature from the decade of 1880? You are still 0.4C short, dummy. And that's without any of the predicted positive feedbacks.Oop, climate scientist poser still off the rails.. try actual Climate Change for a change, son!
Stay tuned for likely more episodes of "As The Dingbat Squirms" or "Watch Shameless Deniers Deny The Bleeding Obvious"
So where is the missing heat?
Less than a 1C rise in associated temperature for an atmospheric CO2 change from 280 ppm to 420 ppm.
Where is the missing heat, Grumblenuts ????
dRF=5.35ln(420/280) = 2.1692 W/m^2
2.169238328 W/m^2 x 0.75 C deg / W/m^2 = 1.6269 C deg
So why didn't the temperature rise by 1.6269 C deg when CO2 rose from 280 ppm to 420 ppm?
Why Grumblenuts , why?
Grumblenuts
Gold Member
- Oct 16, 2017
- 16,066
- 5,544
- 210
No idea why you imagine your one stupid calculation could demonstrate a damned thing, but at least you're on record now admitting that the bulk of the anomalous warming indicated in the charts is likely due to human activity (AGW). No returning to blanket denials for you, son.Why would I need to eat crow. You got it a little closer but you are still 0.4 C below the predicted associated temperature and that's without the so called positive feedback. So where is the missing 0.4 C.
francoHFW
Diamond Member
The big oil big lie g o p is the only political party in the world the denies global warming. You have to be a total moron to be able to ignore all the evidence. Or listen to Fox etc....
Grumblenuts
Gold Member
- Oct 16, 2017
- 16,066
- 5,544
- 210
The linked source is Wikipedia which provides its sources in turn. You, otoh, are not a source. But even a glance at one of your shared charts shows that 1880 is neither the beginning of the Industrial Revolution nor the lowest temperature they could have chosen. Read the linked article if you really wish to know why they chose to start that one chart in 1880, jackass.So you want to use an 1880 reference and pick the lowest temperature from the decade of 1880?
Similar threads
- Replies
- 142
- Views
- 6K
New Topics
-
 Delaney Hall, NJ detention facility.....Feds arrests protestors, including those from out of state
- Started by 1srelluc
- Replies: 0
-
 Women Who Fled Iran Are to Be Deported to Central African Republic, Lawyers Say
- Started by Zincwarrior
- Replies: 10
-
 Is it possible to break through the every day din, followed by the consequent reflexive reactions, and......
- Started by berg80
- Replies: 5
-
Greg Abbott tells PUC, ERCOT not to pass new data center costs to customers
- Started by 1srelluc
- Replies: 3
-
