You are not just ignorant. You're LYING.. Because I've posted Marcotts own description of the lack of temporal resolution in that metastudy..
You literally have NO EVIDENCE of rates in a metastudy of varying global proxies.. Crap statistical exercises that ATTEMPT to divine a MULTI-MILLENIAL GLOBAL AVG --- from just 78 samples around the global of wood, bugs, and ice.
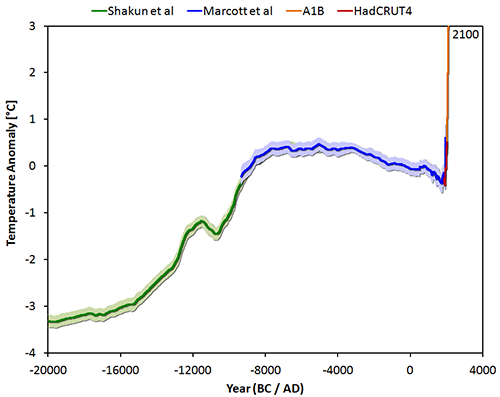
So the chart is comparing highly FILTERED GARBAGE to a BRIEF AND ACCURATE modern 60 yr temperature record.. You REFUSE to learn ANY FACT that contradicts your brainwashing at skepticalscience..
And pal --- You don't have any ocean engineering credentials.. Not with misunderstanding the ups and downs of temporal resolution in a study and your ridiculous claim of catching spikes "because the data has to come back down".. But your quote immediately above just nails your credibility shut --- when you argue that the empty graphs with extended time scales "improve the readibility".. That penciled in distorted GUESS at temperature would be EVEN MORE VERTICAL if you had taken the empty data out to 8000 AD.. The kinda thing that skepticalscience does to add drama to their indoctrinations. You fall for this trash --- right down the chute.. Not even REMOTELY POSSIBLE that you have a hefty engineering background..
From the Marcott FAQ:
Q: Is the rate of global temperature rise over the last 100 years faster than at any time during the past 11,300 years?
A: Our study did not directly address this question because the paleotemperature records used in our study have a temporal resolution of ~120 years on average, which precludes us from examining variations in rates of change occurring within a century. Other factors also contribute to smoothing the proxy temperature signals contained in many of the records we used, such as organisms burrowing through deep-sea mud, and chronological uncertainties in the proxy records that tend to smooth the signals when compositing them into a globally averaged reconstruction. We showed that no temperature variability is preserved in our reconstruction at cycles shorter than 300 years, 50% is preserved at 1000-year time scales, and nearly all is preserved at 2000-year periods and longer. Our Monte-Carlo analysis accounts for these sources of uncertainty to yield a robust (albeit smoothed) global record. Any small “upticks” or “downticks” in temperature that last less than several hundred years in our compilation of paleoclimate data are probably not robust, as stated in the paper.
So, the point is that for any thing remotely like the current situation to have occurred during the period of Marcott's examination, it would have to have come AND GONE in less time than their temporal resolution. And given the magnitude of the temperature change you're talking about, the period involved would have to be on his lower end. Do you really want to suggest that what we have going on now could return to 1880 levels in another 150 years? Before you answer that, you might want to have a look at the CO2 lifetime data.
And what IS your point? Do you have some evidence that such an event DID take place?
If you had ANY engineering chops, you'd know that events smaller than the resolution drop off in magnitude as they approach the temporal resolution of the time record. Marcott TELLS YOU above what the Nyquist criterion does. The temporal resolution is 150 years. Therefore (by nyquist) there is NO RESOLUTION left at 300 yrs. And furthermore, "temperature spikes" that "come and go" in a 1000 yrs would only have 50% of the actual temperature height.
So why are you babbling on about the 1880s?? These proxy reconstructions couldn't even differentiate the 1880s from the 1580s !!!!!! (( or the 2180s !!!!)) Could have missed the Little Ice Age and the Med Warm Period if not for sheer luck of WHEN the center of sample occurred. ((or a little fiddling with the proxies))
What is MY POINT?? Just made it. Marcott, Shakun, Mann --- ALL THOSE METASTUDIES are useless in terms of making statements about RATES of climate change over even 300 or 500 year periods. Their is no information to be found for events shorter than about 400 years.
Do I have evidence that such events DID take place? Yup.. Have told you MANY MANY MANY times, but not penetrated your skepticalscience brain damage..
THINK IT WILL WORK THIS TIME?? ((anybody want to place odds?? The house has it at 25:1 against))
The INDIVIDUAL PROXIES that are centered on a SINGLE GEOGRAPHICAL LOCATION and a single TYPE of proxy --- have higher resolutions and are NOT subject to the crappy effects of trying to extend 75 surface samples to cover the entire ******* globe.
So the INDIVIDUAL PROXIES DO SHOW --- considerably more detail in the temp records. And MANY of those CLEARLY show evidence that -- for instance -- the MWPeriod WAS higher in temperature and WIDER in geography than your lying heroes have asserted.
Making general bullshit statements about Global Averages of ancient climates based on proxy studies is a political neccessity. Because the AGW Church has to tie that into the ONLY NUMBER that John Q Moron knows.. And that is the Mean Global Annual Surface Temperature. These folks are not interested in ancient climate studies. They need to supply BS for skepticalscience to pencil in the message. And to keep YOU as a believer.