Official Coronavirus Thread - Up to the minute Coronavirus map and count.

Yesterday was Indianapolis's worse rise. Yesterday.
The curve isn't even beginning to curve down. What happens over a period of a few days is too short to show anything.
That's Indianapolis. The charts show that nationally deaths and new cases are decreasing. That could be temporary, but at this point it's moving in the right direction.
 
I watched the gov of michigan yesterday, they have a rise in cases, not over any curve there yet. here in az our numbers are suppose to peak later.
The media reports this as if all that matters is new york, specifically nyc. That's where the media lives, that's how new yorkers are.
 
The curves for these quantities are bending down. It looks like we are reaching the peak long before we were predicted to/

United States Coronavirus: 369,179 Cases and 11,013 Deaths - Worldometer
View attachment 320248
View attachment 320245
Some 1,500 people with moderate to severe symptoms were given the drug combination starting just over 7 days ago. This is also the length of time moderate cases become life threatening. This drop is due to people no longer needing intervention. Coincidence? The numbers are to large to be coincidence.
I would LOVE to see the link to the evidence supporting your post.....of 1500 people in the hospital being given the drug....and not needing intensive care.... that would be great news!

but where is this study or evidence?

Link Please!

Go to the up to the date numbers thread.

I've been posting on Italy and Spain for a week now.

They seem to be on the back side of the curve, albeit slowly coming down.

Our numbers are meaningless.

New York, New Jersey, and now Michigan and Lousiana skew things way out of proportion.

Wyoming has yet to report a death.

Many of the deaths we are reporting are specious.

But, New York continues to die. Just checked 780 so far today.

That place is a mess.
 
the virus is hop scotching across the country - cities that were down last week show increases this week and vice versa-

trump shits on the sidewalk and his drones credit his lying ass for nothing.

SSDD
 
Yesterday was Indianapolis's worse rise. Yesterday.
The curve isn't even beginning to curve down. What happens over a period of a few days is too short to show anything.
That's Indianapolis. The charts show that nationally deaths and new cases are decreasing. That could be temporary, but at this point it's moving in the right direction.

your bullshit thread happened over night - yesterday's RIGHT DIRECTION

 
Yesterday was Indianapolis's worse rise. Yesterday.
The curve isn't even beginning to curve down. What happens over a period of a few days is too short to show anything.
That's Indianapolis. The charts show that nationally deaths and new cases are decreasing. That could be temporary, but at this point it's moving in the right direction.
If you look at Spain and Italy, they have bee on a downward slope for the past 7-10 days.

We should follow.

What I don't understand is New York.

I think they've ignored a lot of warnings since this got back and now they are really fucked.

800 deaths just today.
 
the virus is hop scotching across the country - cities that were down last week show increases this week and vice versa-

trump shits on the sidewalk and his drones credit his lying ass for nothing.

SSDD

BullfuckingShit.

Huge cities are still doing fine and Washington is coming under control.
 
The curves for these quantities are bending down. It looks like we are reaching the peak long before we were predicted to/

United States Coronavirus: 369,179 Cases and 11,013 Deaths - Worldometer
View attachment 320248
View attachment 320245

I will explain my post # 2 by illustrating with full graphs what flattening the curve looks like. We have we think flattened the curve. You should pay attention to me because this is coming from someone who has been through the whole thing and we are now coming out the other side of this.

As of April 6 yesterday we think we have flattened the curve this is because we have now had 7 days of lower figures across all levels, it is our intention now to begin lifting the total lockdown. We are aiming to begin this slowly on April 14 and then more lifting measures on May 1 and we aim to have the total lockdown lifted by mid-May. This ALL though will occur IF the peoples continue to social distance and wear the masks until at least September and IF the curve begins to rise again we will have to reintroduce the total lockdown. But we are aiming to be open by mid-May.

The idea is that on April 14 we reopen the majority of stores and hotels and restaurants and bars and so peoples will be able to go out and enjoy these things again, BUT this will have to be closely monitored, we NEED to stress that this is NOT 100% over, we are still getting COVID-19 cases but on a greatly reduced level with the majority testing 97% mild conditions. We still have to be careful, we cannot immediately going back to as it was before, we have to do it in stages and monitor how it's going, if it's going okay we can reintroduce other measures etc

We want to be able to get as many peoples back to work by May 2, with this they can travel but NOT outside our borders, our borders will be remaining closed as will flights outside of the nation and flights into the nation, we do not want peoples travelling in and out to possible nations who are still in a complete crisis. We want to get as many children back into schools also by May 2.

We need to get out of this total lockdown, as we are seeing encouraging numbers, lower serious cases and greater recovery levels we see no need to keep everyone in a total lockdown. The ONLY peoples who will have to stay in the total lockdown will be those over 70 years in age and those with existing health conditions like cancer, heart problems and Type 2 Diabetes.

You are still going up in the thousands a day because you have not gone on total lockdown, you are not monitoring those with COVID-19 correctly and everyone is doing their own thing from State to State, there is no consistency in how you are dealing with this and that is why it's all getting out of control.

Okay so I will use the below graphs to illustrate what the flattened of the curve across the CRUCIAL levels looks like.

Graph I we peaked on March 26 and from March 31-April 6 we have had now had 7 full days of lower figures, there is now a consistency, the below is flattening the curve America is many many weeks away from producing such figures:

1586271573410.png


Graph II we now have a consistency of our Newly Recovered being higher than our Newly Infected again it shows a consistency that shows we have flattened the curve.

1586271733740.png


Graph III illustrates the massive distance between our Recovery Rate and our Death Rate again it shows a consistency which again shows we have flattened the curve:

1586271793379.png


If we just go on the example of New York this because our population total is nearly the same as New York's.

Our Total Figures as of now are:

Total Cases 12.547 New Cases 250 Total Deaths 243 New Deaths 23 Total Recovered 4.046 Active Cases 8.256 Serious/Critical 243

From our Active Cases we have:

8.060 in a Mild Condition this is 97% of ALL cases. 243 in Serious/Critical Condition this is 3% of ALL cases.

From our Closed Cases we have:

4.046 total recovered this is 95% of ALL cases. 243 deaths this is 5% of ALL cases.

Now let us look at New York's totals they have a population number nearly they same as we have, New York's totals are heading toward the Italy totals in approx 3 weeks and it will get worse in America because New York has NOT been totally isolated from the States that surround and you still have State to State travel you are NOT in a total lockdown which you need to be in this.

New York totals as of now:

Total Cases 138.836 New Cases 6.920 Total Deaths 5.489 New Deaths 731 Active Cases 119.981 they do not show how many Serious/Critical, and I think why they do not is that they have out of those Active Cases a MASSIVE amount in the many thousands who are Serious/Critical

The majority of the COVID-19 cases in New York are in New York City a population of 8.175.133 and so our total population is 8.920.600 so let us compare how successful we have been at dealing with COVID-19 to what a DISASTER New York is - I add that the MAJORITY of the COVID-19 figures for ALL of America are going on in New York City.

New Yorks Total Cases are 138.836 our Total Cases are 12.547
New Yorks New Cases are 6.920 our New Cases are 250
New Yorks Total Deaths are 5.489 our Total Deaths are 243
New Yorks New Deaths are 731 our New Deaths are 23
New Yorks Active Cases are 119.981 our Active Cases are 8.256 (97% = 8.060 in Mild Condition 3% = 243 in Serious/Critical Condition)

We have been a success, New York is a failure and from the Total American COVID-19 figures the big number is from New York.

Here are the Top 5 States with COVID-19:

1586273295104.png


Not also just Blue States like New York, above look at Louisiana a State they have the population of 4.66 millions, this is half what our population is and so let us compare our figures with Louisiana, again Louisiana not doing a good job of dealing with COVID-19.

Louisiana Total Cases 14.867 our Total Cases are 12.547
Louisiana New Cases not showing yet for today our New Cases are 250
Louisiana Total Deaths 512 our Total Deaths are 243
Louisiana Active Cases 14.121 our Active Cases are 8.256 (97% = 8.060 in Mild Condition 3% = 243 in Serious/Critical Condition)

So Louisiana's COVID-19 situation is already worse than our ENTIRE totals for 4 weeks, this suggests that Louisiana's COVID-19 situation is going to get worse because they also are nowhere near flattening the curve.
 
Yesterday was Indianapolis's worse rise. Yesterday.
The curve isn't even beginning to curve down. What happens over a period of a few days is too short to show anything.
That's Indianapolis. The charts show that nationally deaths and new cases are decreasing. That could be temporary, but at this point it's moving in the right direction.
If you look at Spain and Italy, they have bee on a downward slope for the past 7-10 days.

We should follow.

What I don't understand is New York.

I think they've ignored a lot of warnings since this got back and now they are really fucked.

800 deaths just today.
or nobody is dying of anything else in nyc.

I saw that other thread which was very good information.

So, I get your point.

Cuomo has mismanaged this thing from the start. NYC/Newark at one point had 1/6th of the global active cases.

I just checked...that number hasn't changed.
 
the virus is hop scotching across the country - cities that were down last week show increases this week and vice versa-

trump shits on the sidewalk and his drones credit his lying ass for nothing.

SSDD

BullfuckingShit.

Huge cities are still doing fine and Washington is coming under control.


SECOND TIME FOR YOUR STUPID ASS-

6,500 in New York/New Jersey you stupid fuck.

The west has been and remains pretty quiet.

New Orleans fucked up and Michigan (who knows what those dumbasses are doing).

For the rest of us I'll say....it's no big fucking deal.
 
Yesterday was Indianapolis's worse rise. Yesterday.
The curve isn't even beginning to curve down. What happens over a period of a few days is too short to show anything.
That's Indianapolis. The charts show that nationally deaths and new cases are decreasing. That could be temporary, but at this point it's moving in the right direction.
If you look at Spain and Italy, they have bee on a downward slope for the past 7-10 days.

We should follow.

What I don't understand is New York.

I think they've ignored a lot of warnings since this got back and now they are really fucked.

800 deaths just today.

You are on our estimates following the same curve as Spain and Italy and in approx 3 weeks America will see a massive increase in COVID-19 New Cases and also New Deaths, you will get to Spain and Italy levels this because you have not put New York in TOTAL ISOLATION from the rest of ALL America, especially the States that surround it and you still are not in total lockdown you have State to State travel and this is why you are not containing this thing because with this State to State travel you are allowing it to spread.

Spain already today has 3.835 New Cases they are not on a downward slope. You only can say you are on a downward slope when your Newly Recovered is going higher every day for 7 days than your Newly Infected is going lower, the below illustrates that Spain is not flattening the curve also Italy is not see second below graph:

1586274867669.png


1586275004249.png
 
the virus is hop scotching across the country - cities that were down last week show increases this week and vice versa-

trump shits on the sidewalk and his drones credit his lying ass for nothing.

SSDD

BullfuckingShit.

Huge cities are still doing fine and Washington is coming under control.


SECOND TIME FOR YOUR STUPID ASS-

6,500 in New York/New Jersey you stupid fuck.

The west has been and remains pretty quiet.

New Orleans fucked up and Michigan (who knows what those dumbasses are doing).

For the rest of us I'll say....it's no big fucking deal.

FROM THE REST OF US -YOURE A F'N IDIOT.
 
Yesterday was Indianapolis's worse rise. Yesterday.
The curve isn't even beginning to curve down. What happens over a period of a few days is too short to show anything.
That's Indianapolis. The charts show that nationally deaths and new cases are decreasing. That could be temporary, but at this point it's moving in the right direction.

The trend is still going up. There will be around 15000 - 20000 deaths by Easter. Testing has been a disaster in California. Taking way too long.
 
P0rn, booze, tobacco, weed, chocolate consumption up. Way up.

"Friedrich Nietzsche famously argued: "That which does not kill us, makes us stronger." If the German philosopher could peruse social media in the coronavirus era, he might change his view.

Housebound and bored, people appear to be drinking more booze, toking more weed, watching more porn and smoking more butts. These behaviours may alleviate the monotony of short-term lockdown stress but store up costs for the future."


Monkey see, monkey do. Don't believe the zoo. Some inhale and get cancer.
 
the virus is hop scotching across the country - cities that were down last week show increases this week and vice versa-

trump shits on the sidewalk and his drones credit his lying ass for nothing.

SSDD

BullfuckingShit.

Huge cities are still doing fine and Washington is coming under control.


SECOND TIME FOR YOUR STUPID ASS-

6,500 in New York/New Jersey you stupid fuck.

The west has been and remains pretty quiet.

New Orleans fucked up and Michigan (who knows what those dumbasses are doing).

For the rest of us I'll say....it's no big fucking deal.

FROM THE REST OF US -YOURE A F'N IDIOT.

Actually, many of the "rest of us" are starting to see where you overreacted and would not listen.

So I think the F'n idiot in this conversation has a car for an avatar.
 
what is the advantage of testing? please inform me.

I tried to discuss with WillPower yesterday. If he has it, then I was hoping he would call his doctor and get tested. He was saying that he lost energy and was sleepy. It is one of the symptoms as well as the strong flu symptoms he hadn't experienced before. Then he would contact a doctor and take his recommendation, probably to get a test.

There's more to testing as it is our first line of defense.
 
EVADGPQXQAMKMw2


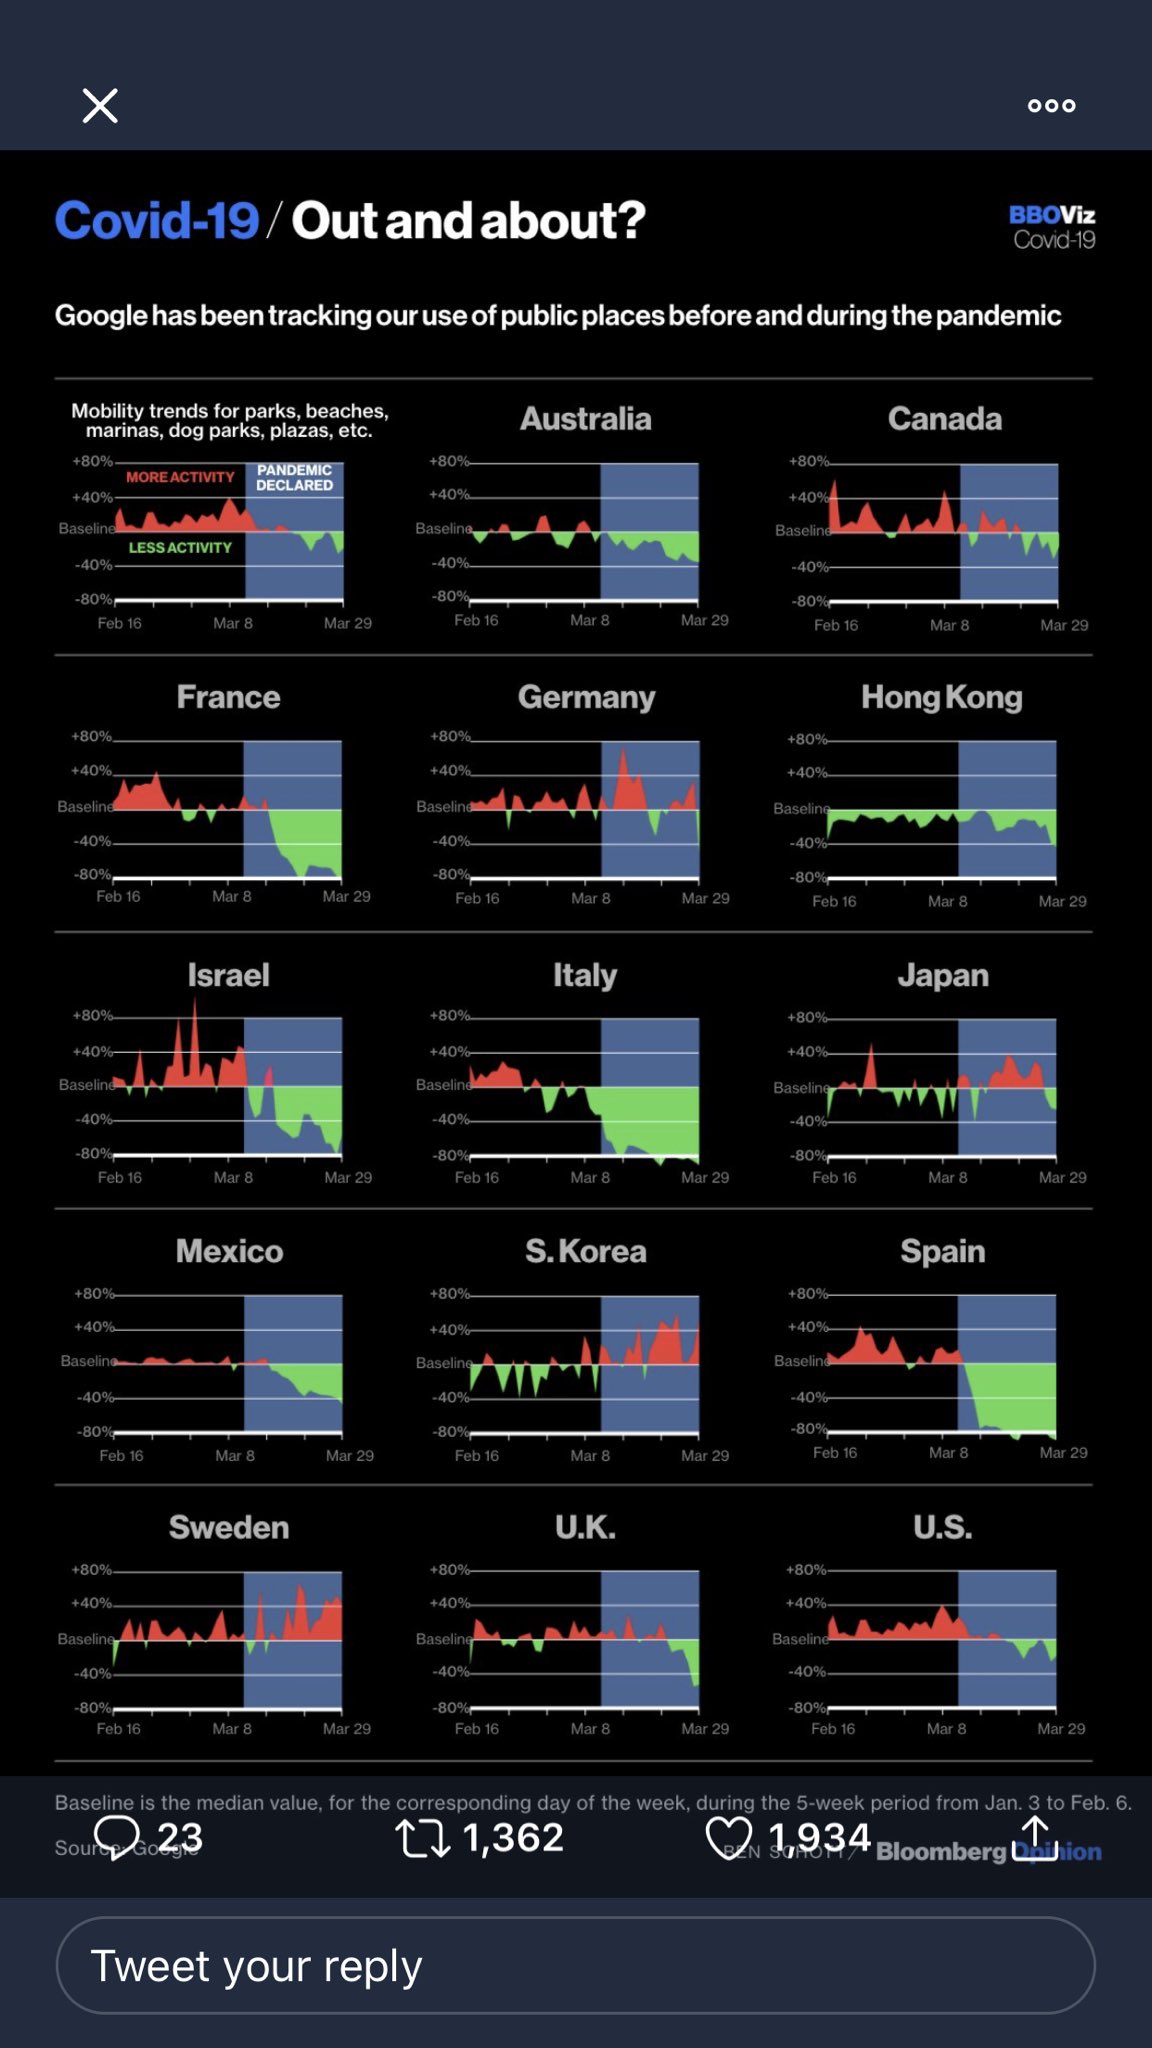
An incredible chart: three countries had earlier and more effective “social distancing” than any others: France, Italy, and Spain - the three countries with the WORST epidemics. Wonder why. (Maybe because most transmission is intrafamilial and nosocomial? Just spitballing here.)
 
Yesterday was Indianapolis's worse rise. Yesterday.
The curve isn't even beginning to curve down. What happens over a period of a few days is too short to show anything.
That's Indianapolis. The charts show that nationally deaths and new cases are decreasing. That could be temporary, but at this point it's moving in the right direction.
If you look at Spain and Italy, they have bee on a downward slope for the past 7-10 days.

We should follow.

What I don't understand is New York.

I think they've ignored a lot of warnings since this got back and now they are really fucked.

800 deaths just today.

You are on our estimates following the same curve as Spain and Italy and in approx 3 weeks America will see a massive increase in COVID-19 New Cases and also New Deaths, you will get to Spain and Italy levels this because you have not put New York in TOTAL ISOLATION from the rest of ALL America, especially the States that surround it and you still are not in total lockdown you have State to State travel and this is why you are not containing this thing because with this State to State travel you are allowing it to spread.

Spain already today has 3.835 New Cases they are not on a downward slope. You only can say you are on a downward slope when your Newly Recovered is going higher every day for 7 days than your Newly Infected is going lower, the below illustrates that Spain is not flattening the curve also Italy is not see second below graph:

View attachment 320275

View attachment 320277

1586276560716.png
 

Forum List

Back
Top