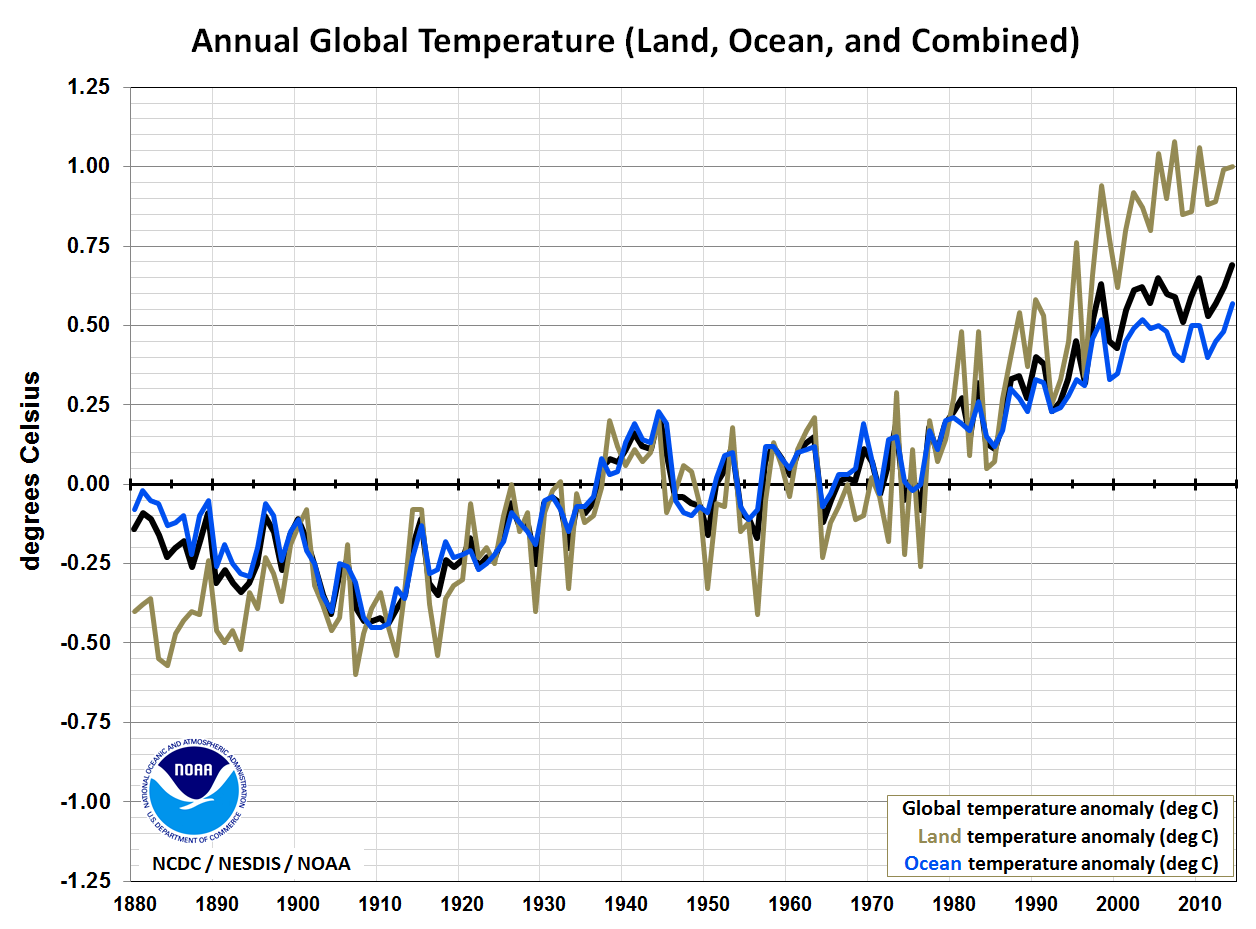
0.4C difference in 2014. my question is....how long can the two surfaces continue to diverge?
my comment is...skeptics have been complaining that 'adjustments' have been arbitrarily adding to recent temps and subtracting from past temps.
I think this graph gives evidence that this may be happening. anybody else have an opinion?
(I am not vouching for the accuracy of these temps, just commenting on them)